B. subtilis Expression Data Browser
Start Page
B. subtilis Expression Data Browser
Gene/Segment:
ytkA
Locus Tag:
BSU30660
Details about ytkA
Show/Hide
Highest Expression Conditions
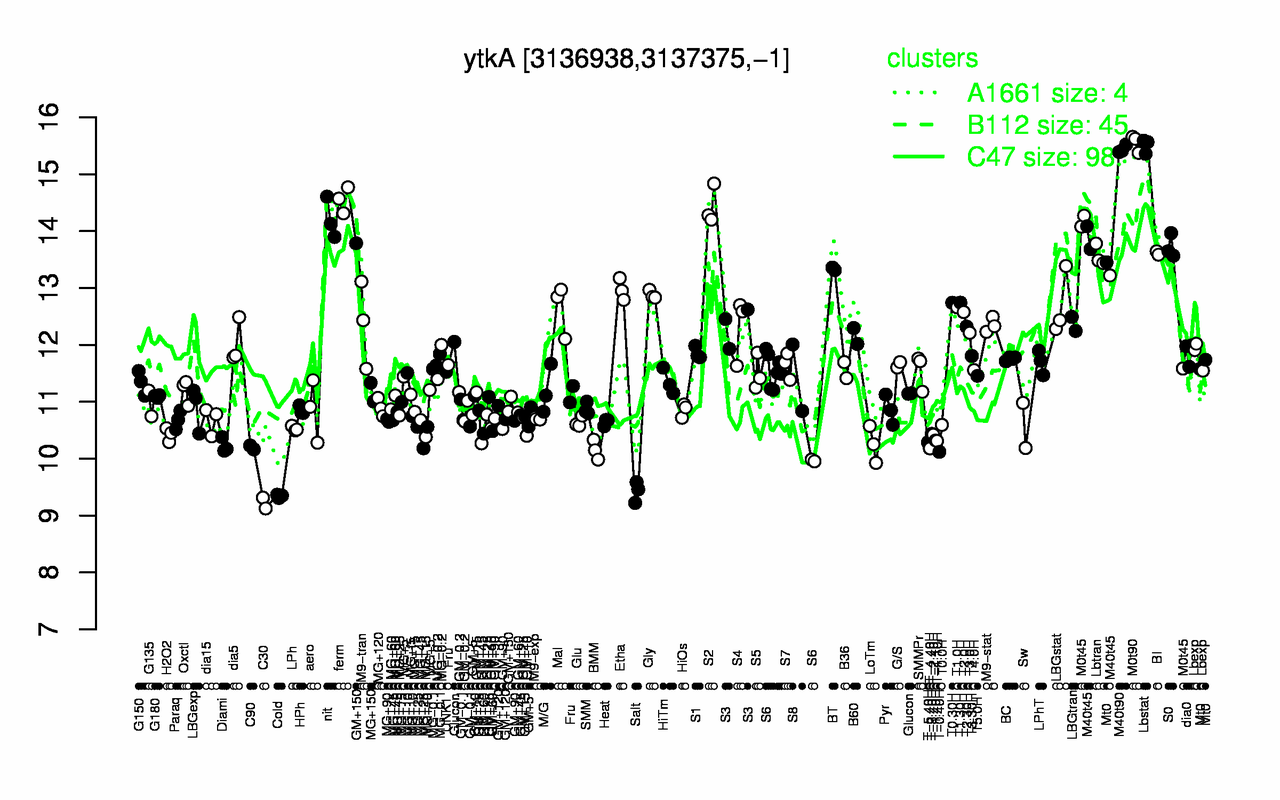
M0t90
Lbstat
M40t90
ferm
S2
nit
S0
M40t45
BI
Lbtran
15.6
15.5
15.4
14.6
14.4
14.2
13.7
13.7
13.6
13.6
Lowest Expression Conditions
C30
Cold
Salt
T-0.40H
BMM
T-4.40H
C90
Diami
LoTm
T-5.40H
9.22
9.34
9.42
10.1
10.2
10.2
10.2
10.2
10.3
10.3
Most Positively Correlated Segments
S1172
sboX
resD
sboA
S879
resE
fnr
albA
albB
resC
0.98
0.86
0.85
0.84
0.82
0.81
0.8
0.8
0.8
0.78
Most Negatively Correlated Segments
lmrA
NA
yxlA
dnaC
lmrB
ytqA
S204
S131
lysP
yerO
-0.71
-0.69
-0.69
-0.67
-0.63
-0.63
-0.61
-0.61
-0.6
-0.6
Expression Profile of Segment ytkA
Show/Hide
Annotation of Gene ytkA
Show/Hide
inference
ab initio prediction:AMIGene:2.0
codon_start
1
product
putative lipoprotein
transl_table
11
note
Evidence 3: Function proposed based on presence of conserved amino acid motif, structural feature or limited homology; Product type lp: lipoprotein
db_xref
GI:2635550
protein_id
CAB15044.1
Genomic View of Gene/Segment ytkA
Show/Hide
(Legend)
Browse Genome Context