| Start Page |
|
 |
| Start Page |
|
|
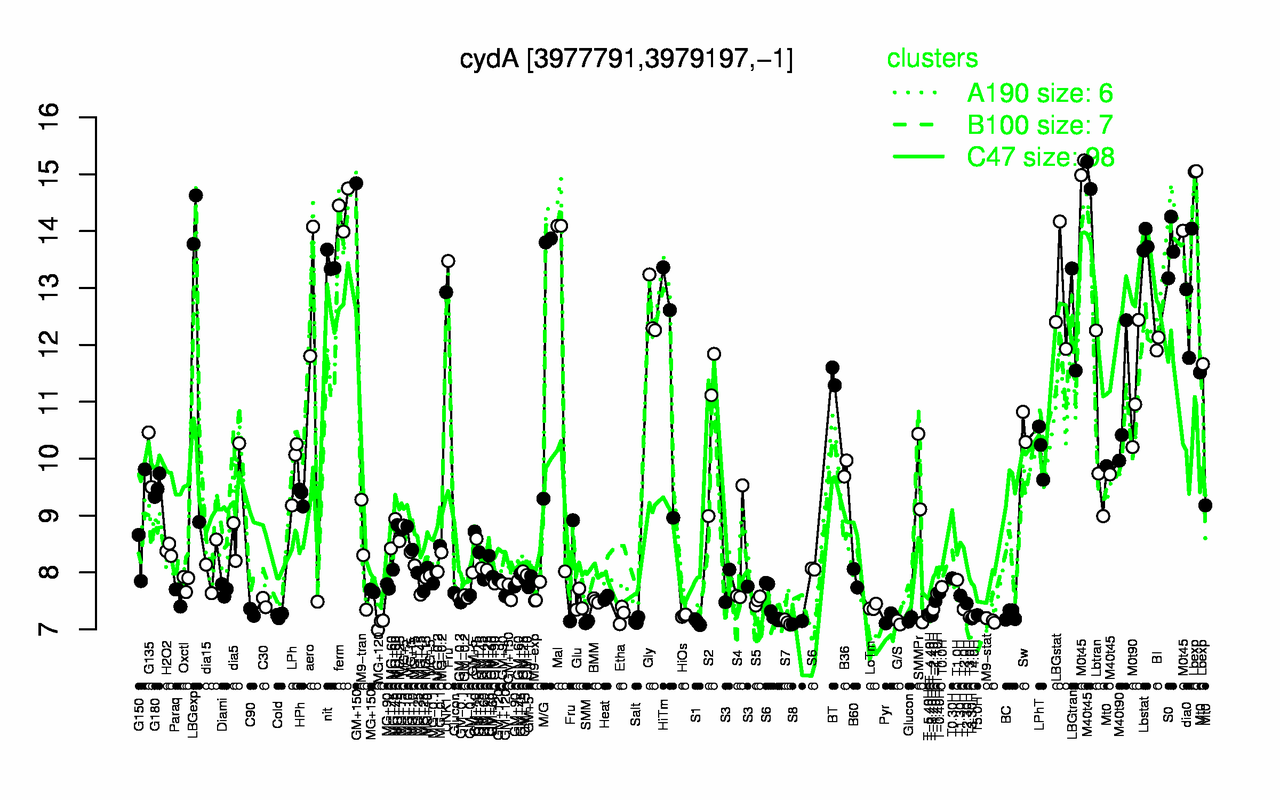
| M0t45 | ferm | Lbexp | Lbstat | S0 | nit | M40t45 | dia0 | UNK1 | LBGstat |
| 14.7 | 14.4 | 13.9 | 13.8 | 13.7 | 13.5 | 13.2 | 12.9 | 12.9 | 12.8 |
| MG+120 | S8 | G/S | SMM | S7 | S1 | Salt | M9-stat | T3.30H | Pyr |
| 7.09 | 7.12 | 7.12 | 7.13 | 7.13 | 7.13 | 7.15 | 7.16 | 7.19 | 7.21 |