| Start Page |
|
 |
| Start Page |
|
|
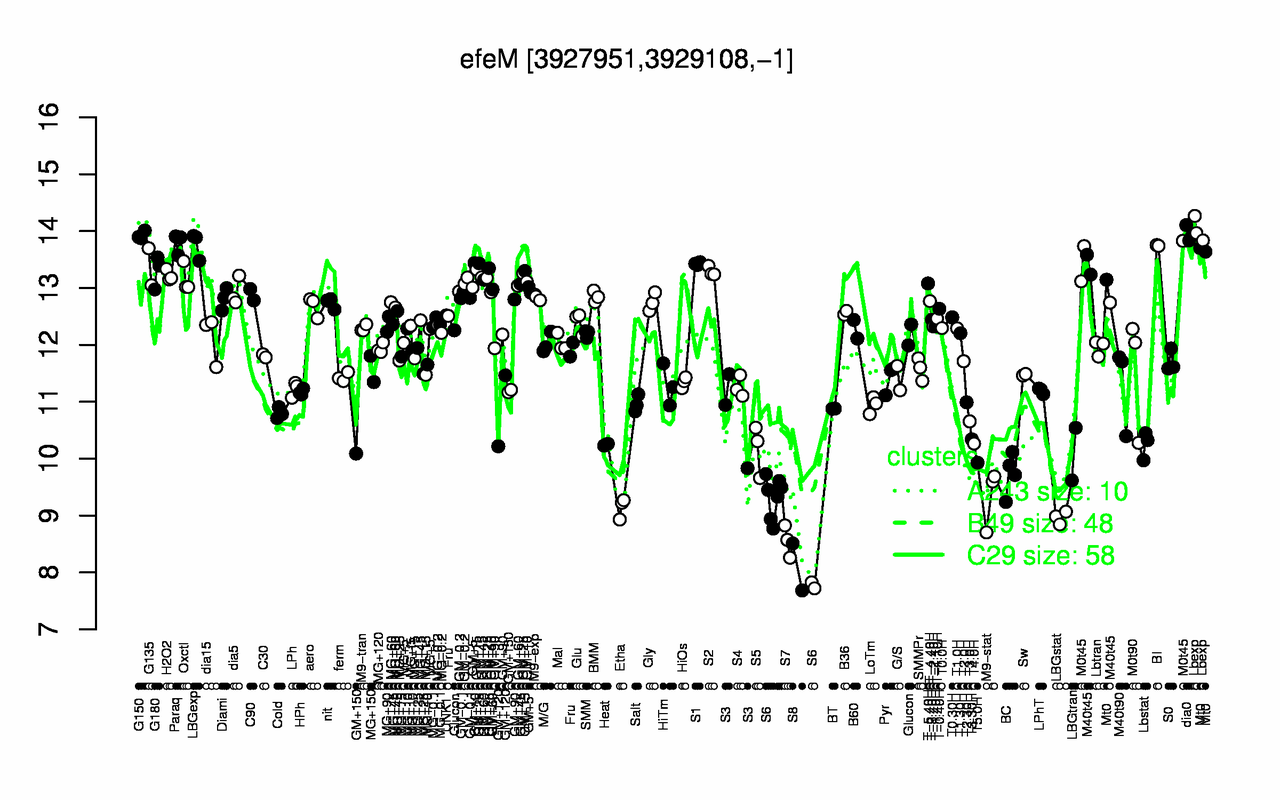
| Lbexp | dia0 | G150 | Paraq | LBGexp | BI | M0t45 | Mt0 | S1 | G135 |
| 14 | 13.9 | 13.9 | 13.8 | 13.8 | 13.7 | 13.6 | 13.5 | 13.4 | 13.4 |
| S8 | S7 | LBGstat | S6 | Etha | M9-stat | BC | T5.0H | LBGtran | S5 |
| 8.1 | 8.55 | 8.97 | 8.99 | 9.14 | 9.33 | 9.74 | 9.93 | 10.1 | 10.2 |