| Start Page |
|
 |
| Start Page |
|
|
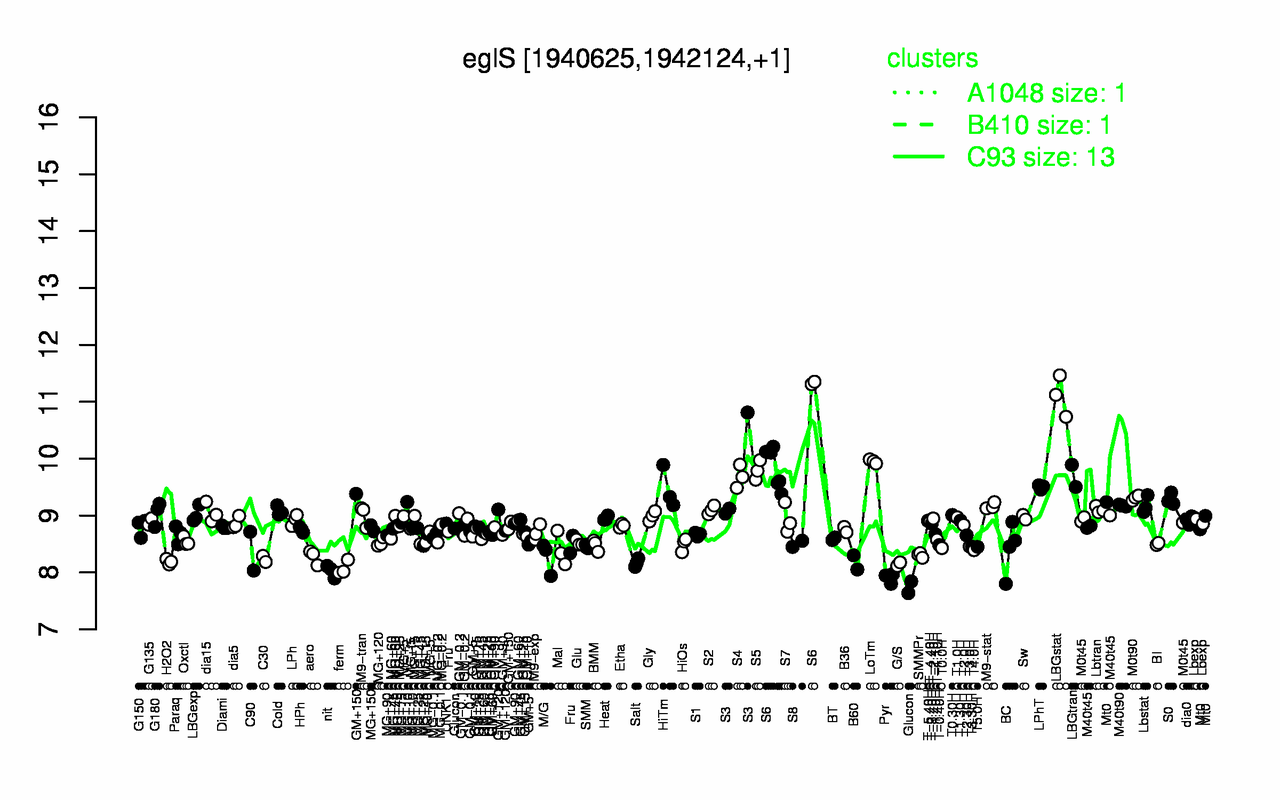
| LBGstat | S6 | LoTm | S5 | LBGtran | S4 | S3 | LPhT | HiTm | M0t90 |
| 11.1 | 10.2 | 9.95 | 9.8 | 9.7 | 9.69 | 9.66 | 9.5 | 9.47 | 9.31 |
| Pyr | nit | ferm | Glucon | G/S | Salt | B60 | H2O2 | C30 | M/G |
| 7.91 | 8.02 | 8.08 | 8.08 | 8.15 | 8.17 | 8.18 | 8.19 | 8.24 | 8.27 |