| Start Page |
|
 |
| Start Page |
|
|
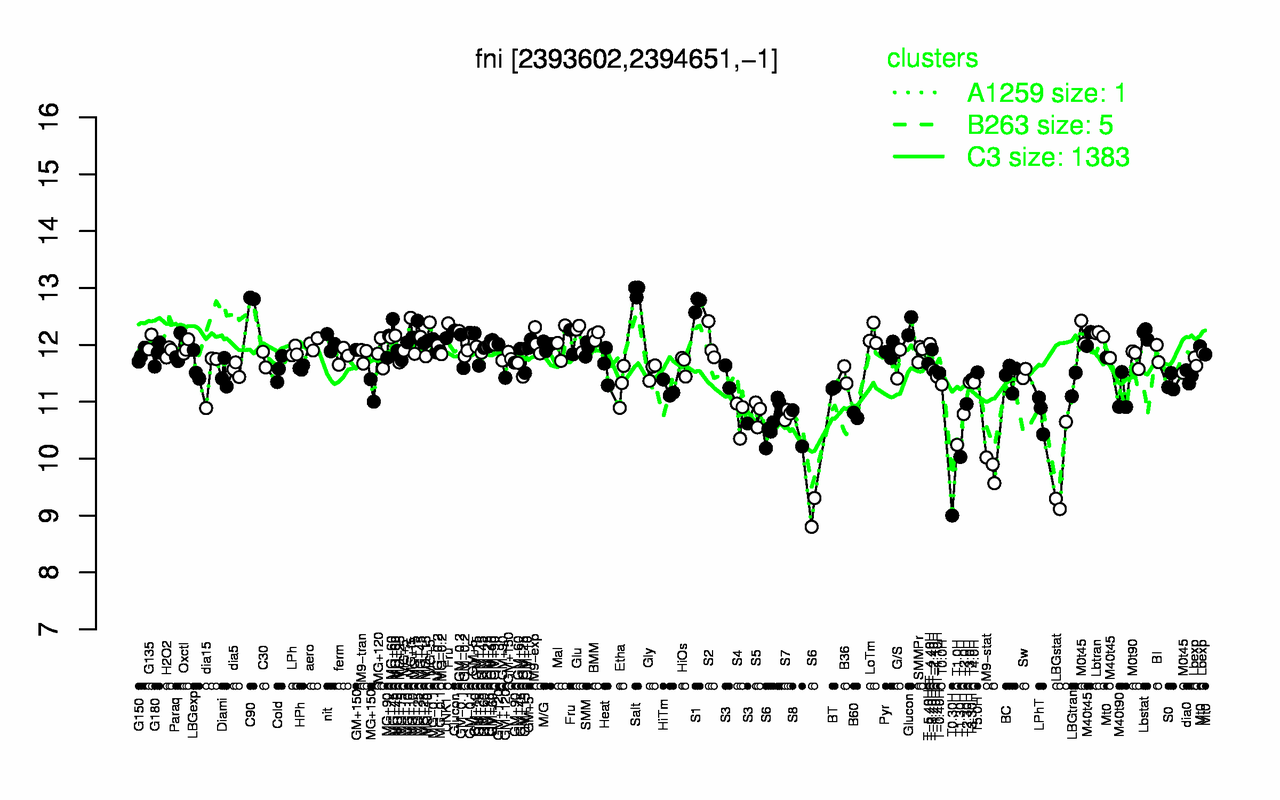
| Salt | C90 | S1 | MG+t5 | Glucon | Lbstat | Lbtran | LoTm | MG+45 | BMM |
| 12.9 | 12.8 | 12.7 | 12.5 | 12.3 | 12.2 | 12.2 | 12.2 | 12.2 | 12.2 |
| T0.30H | LBGstat | M9-stat | T1.30H | T1.0H | S6 | S8 | S4 | B60 | S7 |
| 9 | 9.69 | 9.83 | 10 | 10.2 | 10.3 | 10.5 | 10.7 | 10.8 | 10.8 |