| Start Page |
|
 |
| Start Page |
|
|
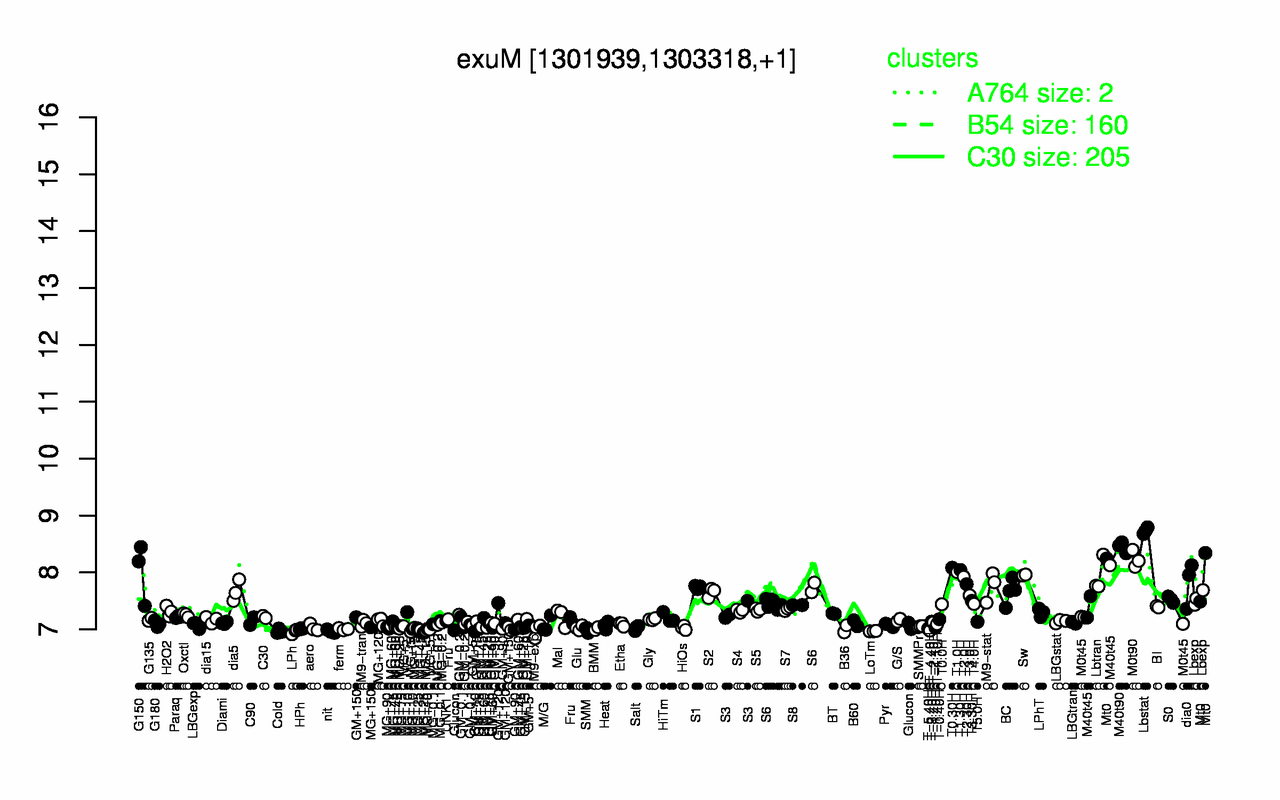
| Lbstat | M40t90 | M0t90 | T0.30H | T1.30H | Mt0 | G150 | T1.0H | Sw | Lbtran |
| 8.73 | 8.45 | 8.23 | 8.08 | 8.04 | 8.03 | 8.02 | 8.01 | 7.95 | 7.94 |
| MG+t5 | LPh | nit | LoTm | Cold | T-4.40H | M9-exp | MG+25 | SMM | ferm |
| 6.96 | 6.96 | 6.96 | 6.97 | 6.97 | 6.98 | 6.98 | 6.99 | 6.99 | 7 |