B. subtilis Expression Data Browser
Details about ftsW Show/Hide
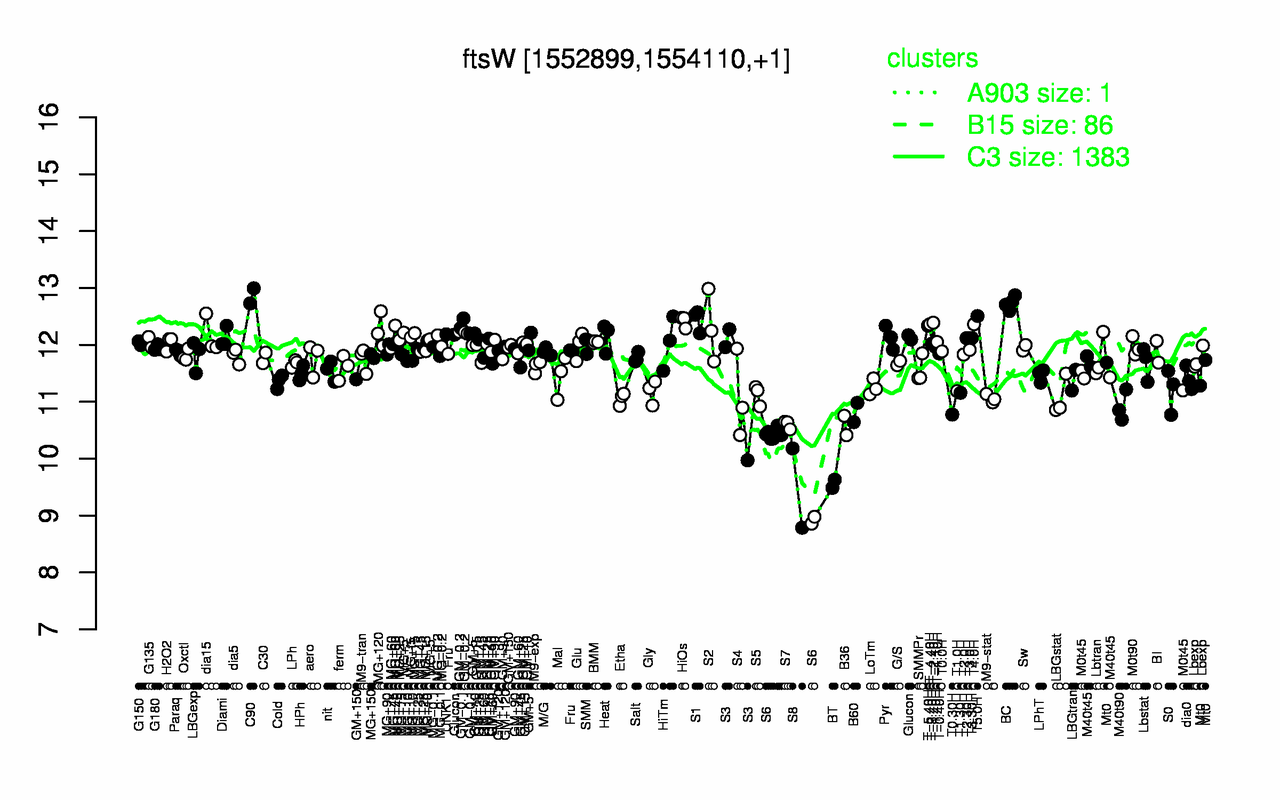
Highest Expression Conditions
C90 BC T5.0H S1 HiOs T-2.40H T4.0H T-4.40H T-5.40H GM-0.1
12.9 12.7 12.5 12.4 12.4 12.4 12.4 12.4 12.3 12.3
Lowest Expression Conditions
S8 BT S6 B36 S7 T0.30H B60 M40t90 Etha M9-stat
9.48 9.56 10.1 10.6 10.6 10.8 10.8 10.9 11.1 11.1
Most Positively Correlated Segments
metA ylmH hisJ S1126 ypdQ yhdV nrdI S567 S1125 ywdD
0.8 0.8 0.79 0.79 0.79 0.77 0.76 0.75 0.74 0.74
Most Negatively Correlated Segments
fadM yrbD S1223 yheF S1170 S841 yndD S1083 S1264 S477
-0.71 -0.71 -0.7 -0.7 -0.7 -0.7 -0.7 -0.7 -0.7 -0.69
Expression Profile of Segment ftsW Show/Hide
Annotation of Gene ftsW Show/Hide
function
16.13: Shape
function
16.1: Circulate
inference
ab initio prediction:AMIGene:2.0
codon_start
1
product
cell-division protein
transl_table
11
note
Evidence 2a: Function of homologous gene experimentally demonstrated in an other organism; PubMedId: 12626683, 15849754, 16850406, 9622350; Product type t: transporter
db_xref
GI:2633856
protein_id
CAB13358.1
Genomic View of Gene/Segment ftsW Show/Hide
(Legend)