| Start Page |
|
 |
| Start Page |
|
|
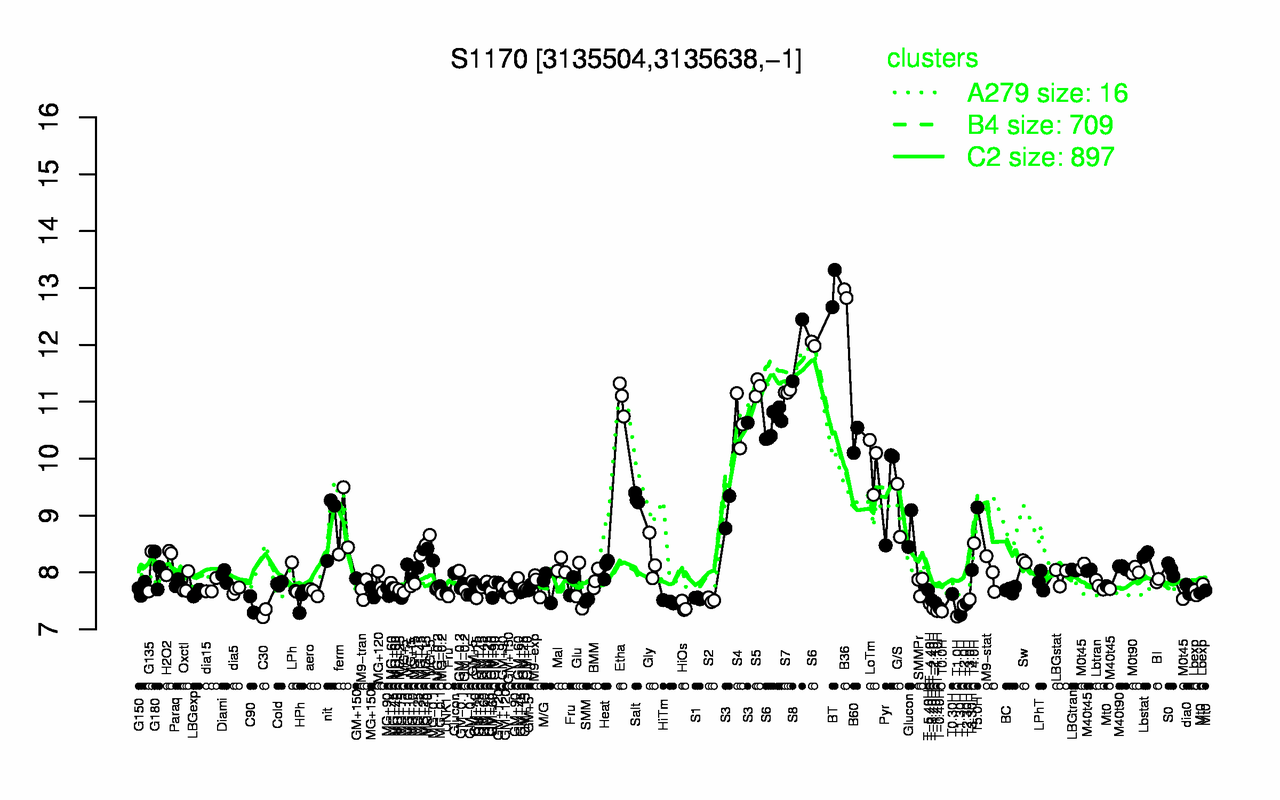
| BT | B36 | S8 | S5 | S7 | Etha | S6 | S4 | B60 | LoTm |
| 13 | 12.9 | 11.9 | 11.3 | 11.2 | 11.1 | 10.9 | 10.6 | 10.3 | 9.93 |
| T1.0H | T1.30H | C30 | T0.0H | T-1.10H | T-2.40H | T-0.40H | HiOs | T2.0H | C90 |
| 7.22 | 7.25 | 7.28 | 7.31 | 7.32 | 7.37 | 7.37 | 7.4 | 7.42 | 7.44 |