| Start Page |
|
 |
| Start Page |
|
|
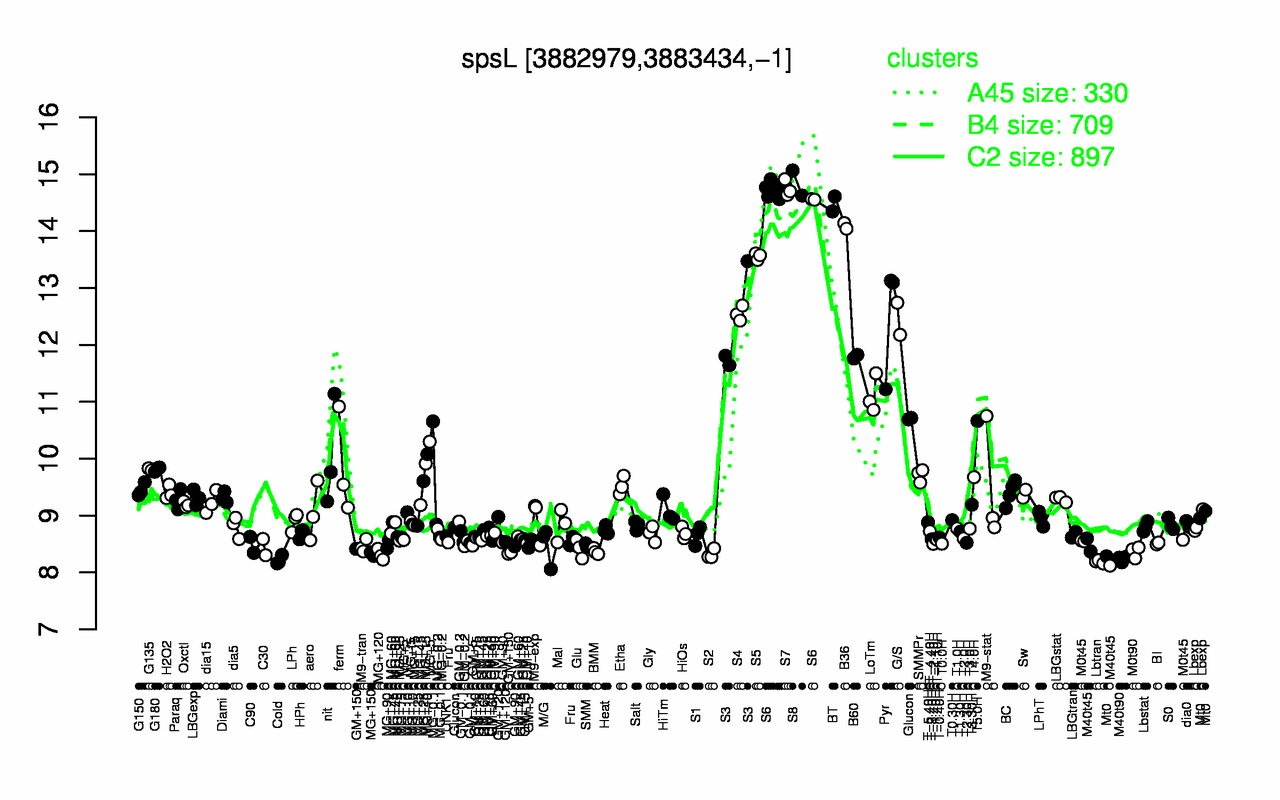
| S8 | S7 | S6 | BT | B36 | S5 | S4 | Pyr | G/S | S3 |
| 14.8 | 14.7 | 14.7 | 14.5 | 14.1 | 13.6 | 12.6 | 12.5 | 12.5 | 12.3 |
| Lbtran | Cold | M40t90 | MG+120 | S2 | MG+150 | M40t45 | M0t90 | GM+150 | BMM |
| 8.19 | 8.22 | 8.24 | 8.31 | 8.32 | 8.32 | 8.36 | 8.36 | 8.37 | 8.37 |