B. subtilis Expression Data Browser
Details about glcT Show/Hide
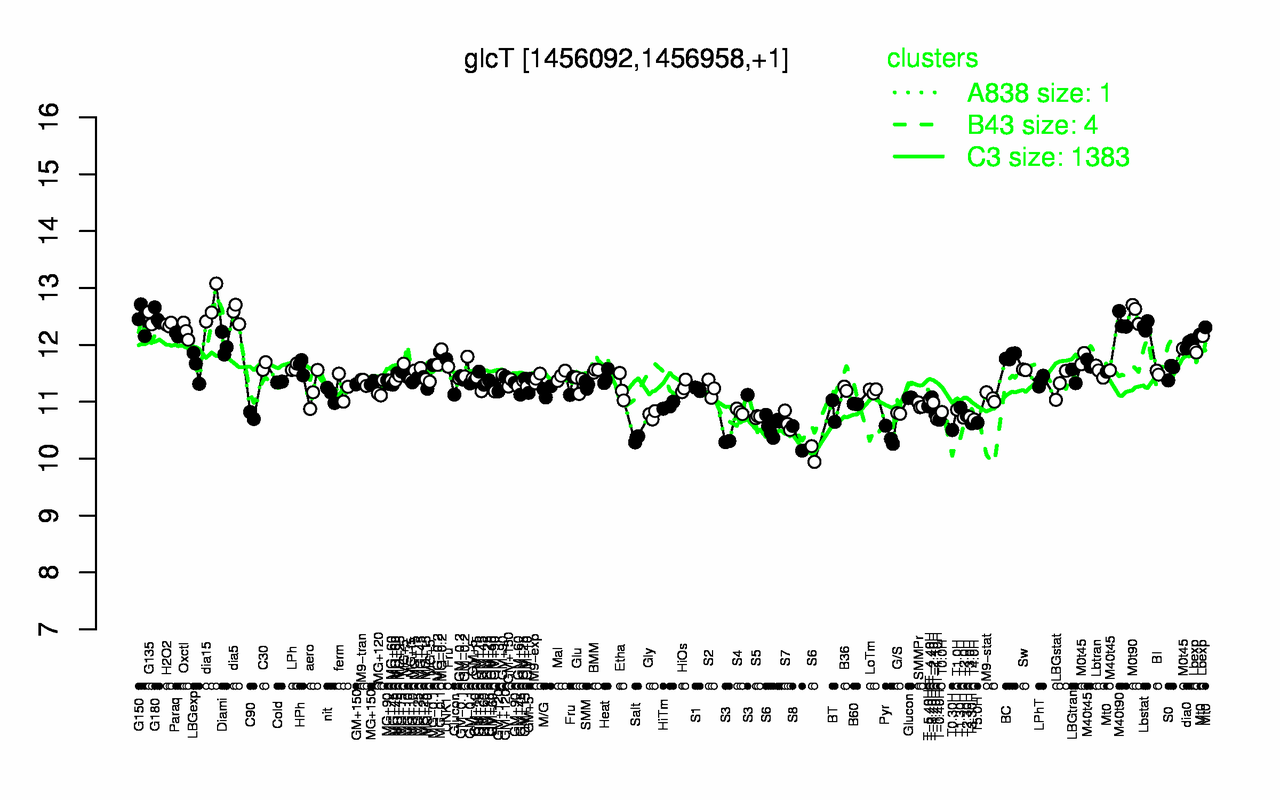
Highest Expression Conditions
dia15 M0t90 dia5 G180 G135 G150 M40t90 H2O2 Lbstat Oxctl
12.7 12.6 12.6 12.5 12.5 12.4 12.4 12.4 12.3 12.2
Lowest Expression Conditions
Salt S8 Pyr S6 T0.30H S3 T3.30H T5.0H S7 T-0.40H
10.4 10.4 10.4 10.5 10.5 10.6 10.6 10.6 10.7 10.7
Most Positively Correlated Segments
S504 ykvZ yxdK yttB ydeG ybbR smc ytxK S1161 coaD
0.78 0.77 0.77 0.75 0.74 0.74 0.73 0.73 0.73 0.73
Most Negatively Correlated Segments
yhzC ykwB yuaI yuiA yuaG S1534 yuzK ytzI S254 S1259
-0.76 -0.74 -0.74 -0.73 -0.73 -0.73 -0.72 -0.72 -0.72 -0.72
Expression Profile of Segment glcT Show/Hide
Annotation of Gene glcT Show/Hide
function
16.3: Control
inference
ab initio prediction:AMIGene:2.0
codon_start
1
product
transcriptional antiterminator (BglG family)
transl_table
11
note
Evidence 1a: Function experimentally demonstrated in the studied strain; PubMedId: 10974121, 15155854, 17074746; Product type r: regulator
db_xref
GI:225184948
protein_id
CAB13261.2
Genomic View of Gene/Segment glcT Show/Hide
(Legend)