B. subtilis Expression Data Browser
Details about gmk Show/Hide
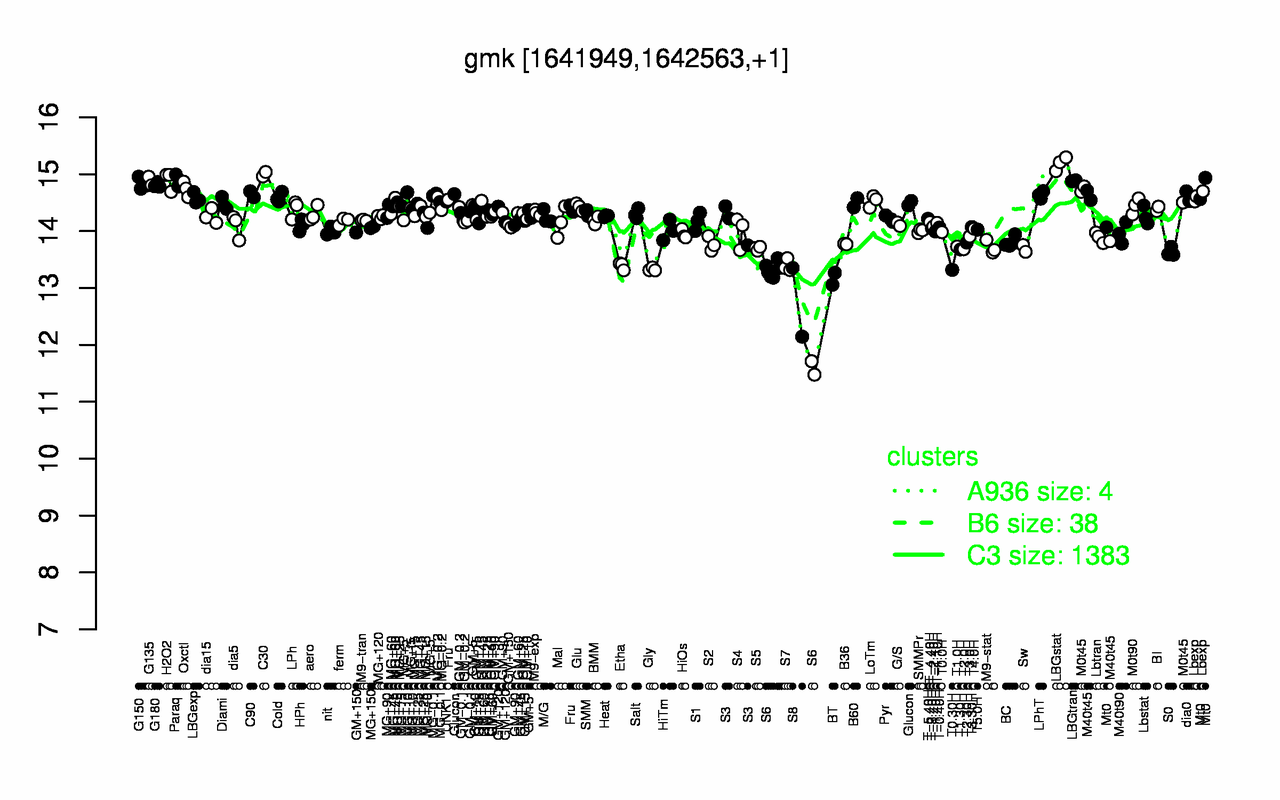
Highest Expression Conditions
LBGstat C30 H2O2 Paraq LBGtran G135 G150 G180 Oxctl M0t45
15.2 15 14.9 14.9 14.9 14.9 14.8 14.8 14.7 14.7
Lowest Expression Conditions
S8 S6 BT T0.30H Gly Etha S7 S0 T1.30H T2.0H
12.7 12.9 13.2 13.3 13.3 13.4 13.4 13.6 13.7 13.7
Most Positively Correlated Segments
ylzA rpoZ yloC coaBC recJ menH ylbH hprK dagK coaD
0.97 0.94 0.84 0.82 0.82 0.82 0.81 0.8 0.8 0.8
Most Negatively Correlated Segments
yjaZ yhzD yvaM ybbF ynzE ybbE S651 ymzB ybbD ybbC
-0.75 -0.74 -0.7 -0.7 -0.69 -0.68 -0.68 -0.68 -0.68 -0.68
Expression Profile of Segment gmk Show/Hide
Annotation of Gene gmk Show/Hide
function
16.2: Construct biomass (Anabolism)
inference
ab initio prediction:AMIGene:2.0
codon_start
1
EC_number
2.7.4.8
transl_table
11
note
Evidence 2a: Function of homologous gene experimentally demonstrated in an other organism; PubMedId: 12682299, 17012781; Product type e: enzyme
db_xref
GI:32468748
product
guanylate kinase
protein_id
CAB13441.2
Genomic View of Gene/Segment gmk Show/Hide
(Legend)