| Start Page |
|
 |
| Start Page |
|
|
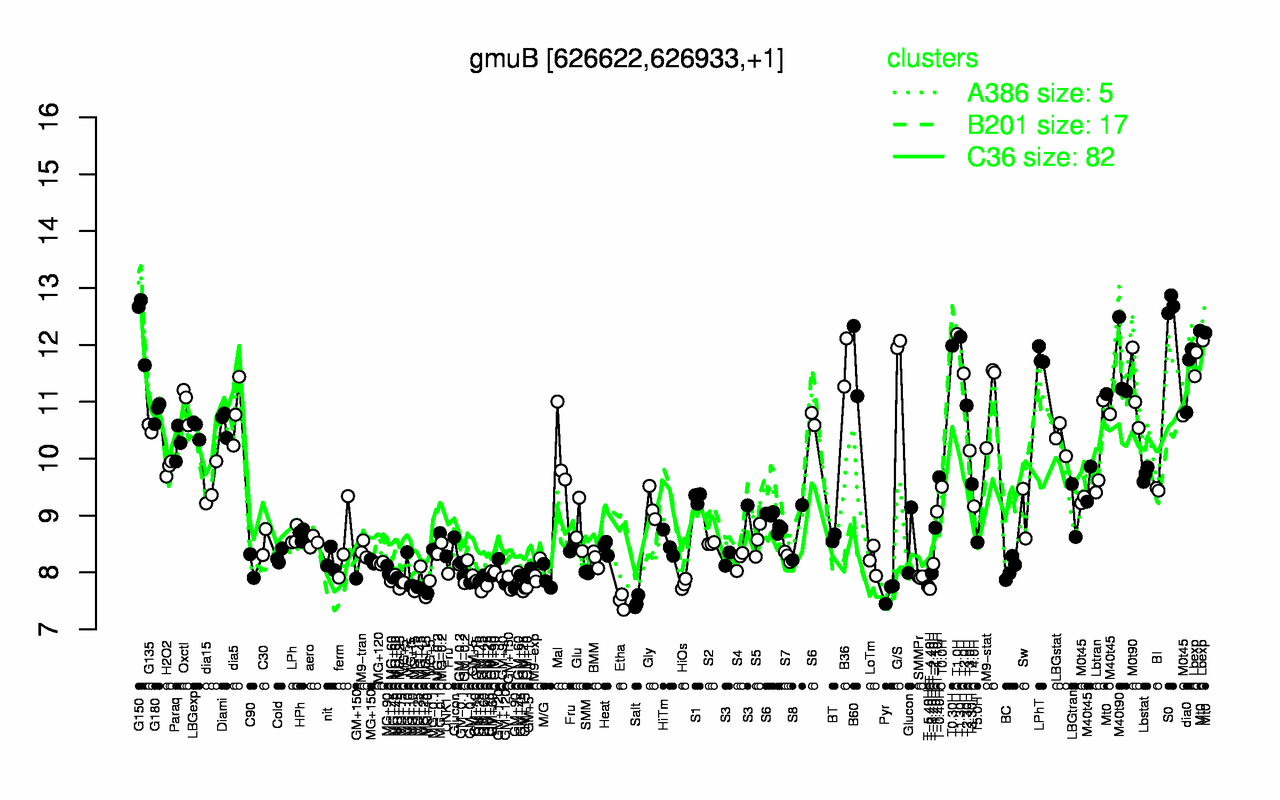
| S0 | G150 | T1.0H | T1.30H | G/S | T0.30H | Mt0 | Lbexp | LPhT | B60 |
| 12.7 | 12.4 | 12.2 | 12.1 | 12 | 12 | 11.9 | 11.8 | 11.8 | 11.7 |
| Salt | Etha | Pyr | MG+15 | T-4.40H | MG+25 | T-5.40H | GM+25 | MG+t5 | GM+10 |
| 7.48 | 7.49 | 7.65 | 7.69 | 7.71 | 7.72 | 7.76 | 7.76 | 7.76 | 7.78 |