| Start Page |
|
 |
| Start Page |
|
|
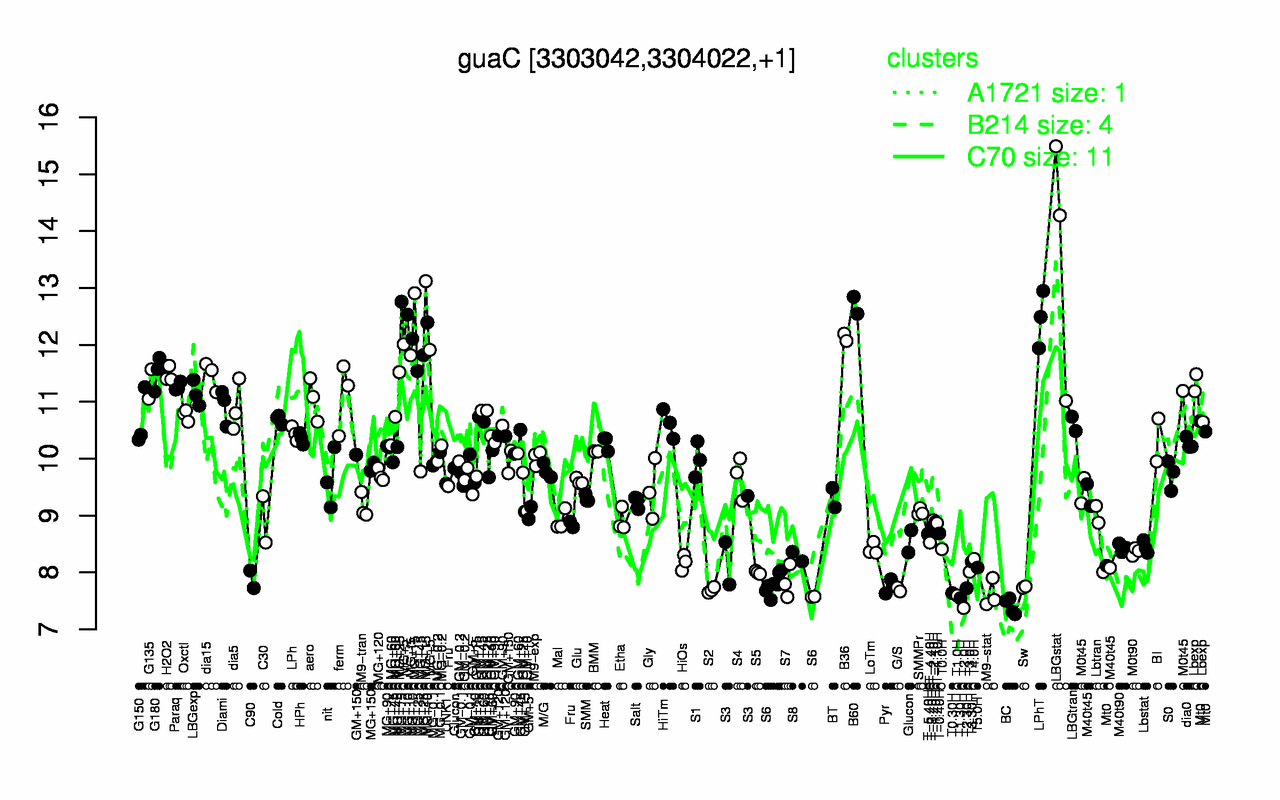
| LBGstat | MG+15 | B60 | LPhT | MG+10 | B36 | MG+5 | MG+t5 | MG+25 | G180 |
| 13.6 | 12.9 | 12.7 | 12.5 | 12.3 | 12.1 | 12 | 11.8 | 11.6 | 11.5 |
| T2.0H | BC | T1.30H | T1.0H | M9-stat | T0.30H | S2 | G/S | T2.30H | Sw |
| 7.37 | 7.41 | 7.55 | 7.6 | 7.62 | 7.64 | 7.69 | 7.7 | 7.72 | 7.74 |