| Start Page |
|
 |
| Start Page |
|
|
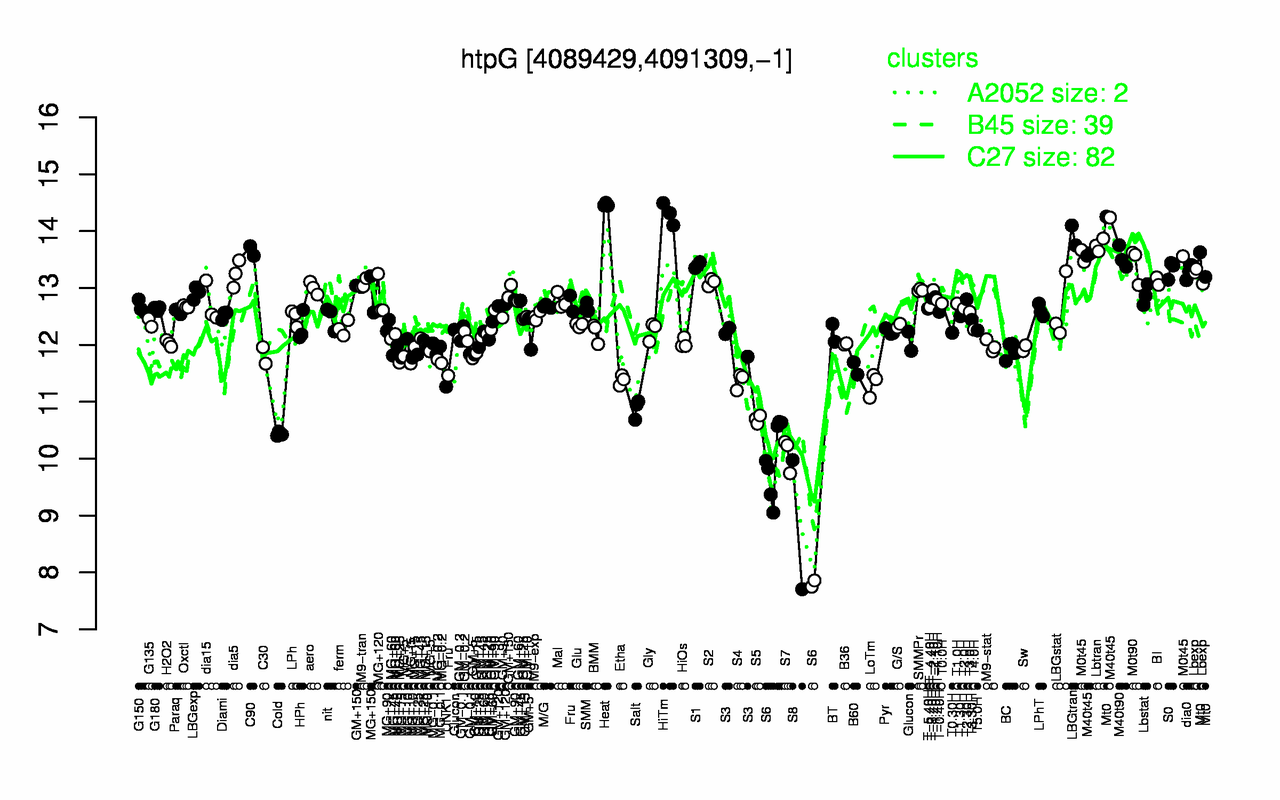
| Heat | HiTm | LBGtran | M40t45 | Lbtran | Mt0 | C90 | M0t45 | M40t90 | M0t90 |
| 14.5 | 14.3 | 13.9 | 13.8 | 13.8 | 13.7 | 13.7 | 13.6 | 13.5 | 13.4 |
| S8 | S6 | S7 | Cold | S5 | Salt | UNK1 | LoTm | S4 | Etha |
| 8.84 | 9.52 | 10.1 | 10.4 | 10.7 | 10.9 | 11.3 | 11.3 | 11.4 | 11.4 |