B. subtilis Expression Data Browser
Start Page
B. subtilis Expression Data Browser
Gene/Segment:
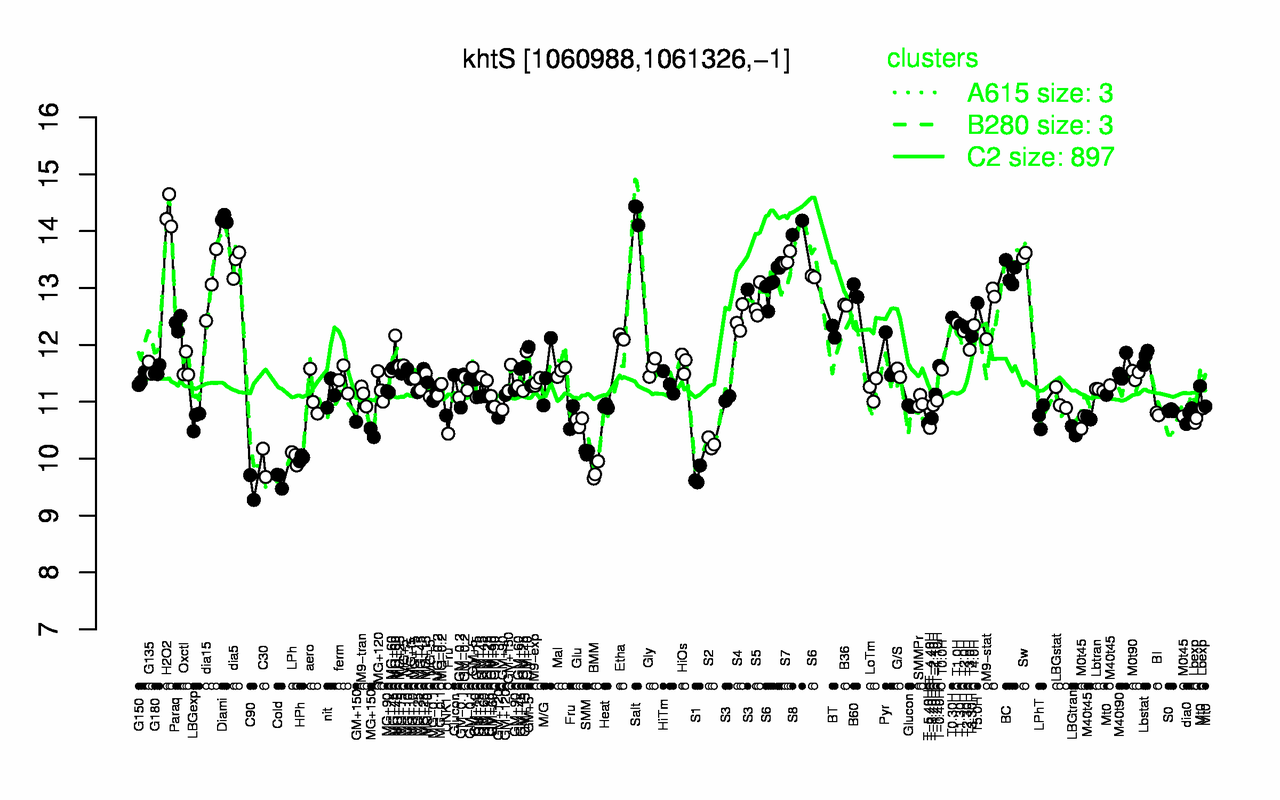
khtS
Locus Tag:
BSU09870
Details about khtS
Show/Hide
Highest Expression Conditions
Salt
H2O2
Diami
S8
Sw
S7
dia5
BC
S6
dia15
14.3
14.3
14.2
14.1
13.6
13.5
13.4
13.3
13.2
13.1
Lowest Expression Conditions
C90
Cold
S1
BMM
C30
HPh
LPh
SMM
S2
MG+150
9.49
9.63
9.69
9.78
9.93
10
10
10.1
10.3
10.5
Most Positively Correlated Segments
khtT
yhaU
ytvB
S1158
ypiA
S411
ywnF
yugP
yugS
mstX
0.95
0.89
0.69
0.67
0.66
0.65
0.65
0.63
0.62
0.62
Most Negatively Correlated Segments
yobI
pdxT
pdxS
S431
fliP
fliZ
ylzI
fliY
fliM
cheY
-0.69
-0.67
-0.66
-0.66
-0.65
-0.65
-0.65
-0.64
-0.64
-0.64
Expression Profile of Segment khtS
Show/Hide
Annotation of Gene khtS
Show/Hide
function
16.1: Circulate
inference
ab initio prediction:AMIGene:2.0
codon_start
1
product
K+/H+ antiporter for K+ efflux
transl_table
11
note
Evidence 1a: Function experimentally demonstrated in the studied strain; PubMedId: 14987767, 17679694; Product type f: factor
db_xref
GI:2633323
protein_id
CAB12827.1
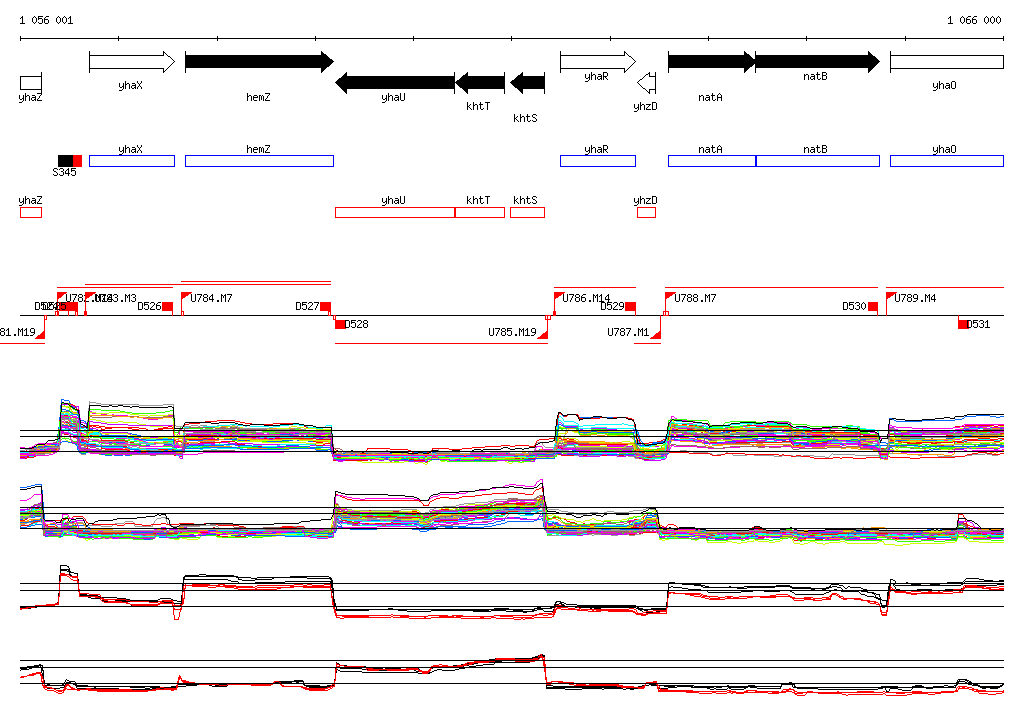
Genomic View of Gene/Segment khtS
Show/Hide
(Legend)
Browse Genome Context