| Start Page |
|
 |
| Start Page |
|
|
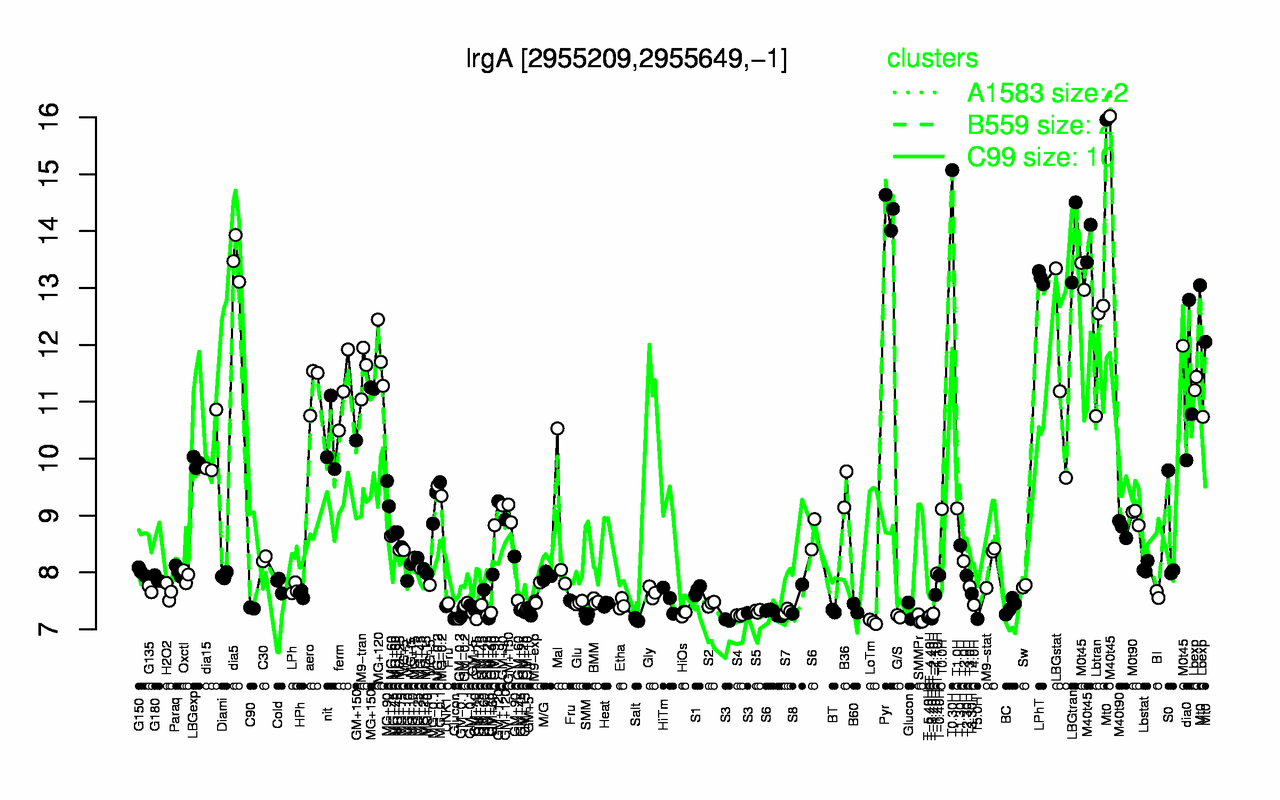
| T0.30H | M40t45 | Pyr | LBGtran | Mt0 | dia5 | LPhT | M0t45 | Lbtran | MG+120 |
| 15.1 | 14.5 | 14.3 | 13.8 | 13.7 | 13.5 | 13.2 | 12.8 | 12 | 11.8 |
| LoTm | Salt | SMMPr | T5.0H | T-3.40H | S3 | T-5.40H | GM+15 | G/S | T-4.40H |
| 7.13 | 7.17 | 7.18 | 7.18 | 7.19 | 7.2 | 7.21 | 7.22 | 7.23 | 7.23 |