B. subtilis Expression Data Browser
Start Page
B. subtilis Expression Data Browser
Gene/Segment:
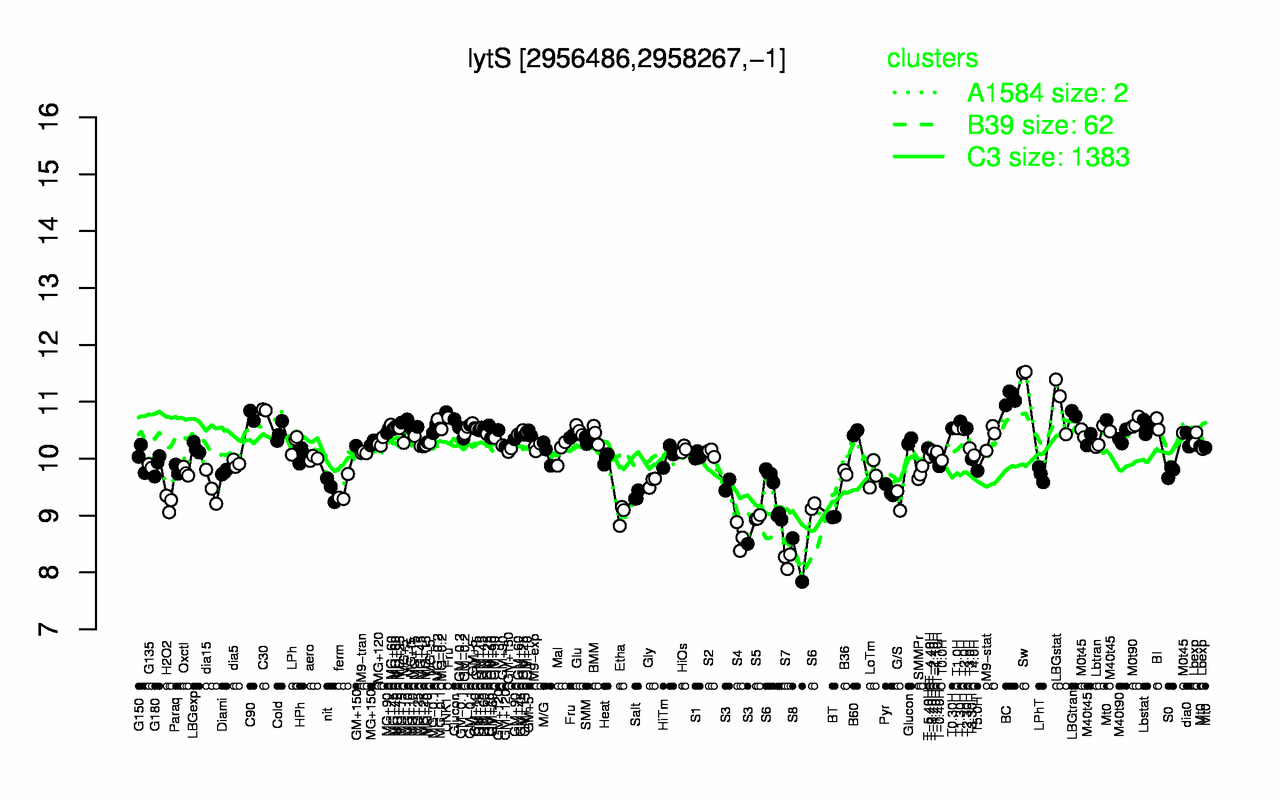
lytS
Locus Tag:
BSU28930
Details about lytS
Show/Hide
Highest Expression Conditions
Sw
BC
LBGstat
C30
UNK1
LBGtran
C90
T1.30H
M0t90
BI
11.5
11.1
11
10.9
10.8
10.8
10.8
10.7
10.6
10.6
Lowest Expression Conditions
S7
S8
S4
S5
BT
Etha
S3
H2O2
G/S
Salt
8.22
8.22
8.63
8.96
8.97
9.02
9.19
9.23
9.26
9.35
Most Positively Correlated Segments
lytT
yuxK
pbpD
recQ
yvfU
bmrA
divIVA
ymdA
yvfT
yheN
0.91
0.78
0.78
0.78
0.77
0.76
0.74
0.73
0.73
0.72
Most Negatively Correlated Segments
S35
yfhE
seaA
spoVT
yfhD
yhfM
yraG
ypzH
adhB
yraF
-0.78
-0.76
-0.75
-0.75
-0.75
-0.75
-0.73
-0.73
-0.73
-0.73
Expression Profile of Segment lytS
Show/Hide
Annotation of Gene lytS
Show/Hide
function
16.12: Sense
function
16.3: Control
function
16.13: Shape
inference
ab initio prediction:AMIGene:2.0
codon_start
1
product
two-component sensor histidine kinase [LytT]
transl_table
11
note
Evidence 2a: Function of homologous gene experimentally demonstrated in an other organism; PubMedId: 10940023, 11717295, 12914674; Product type rc : receptor
db_xref
GI:2635358
protein_id
CAB14853.1
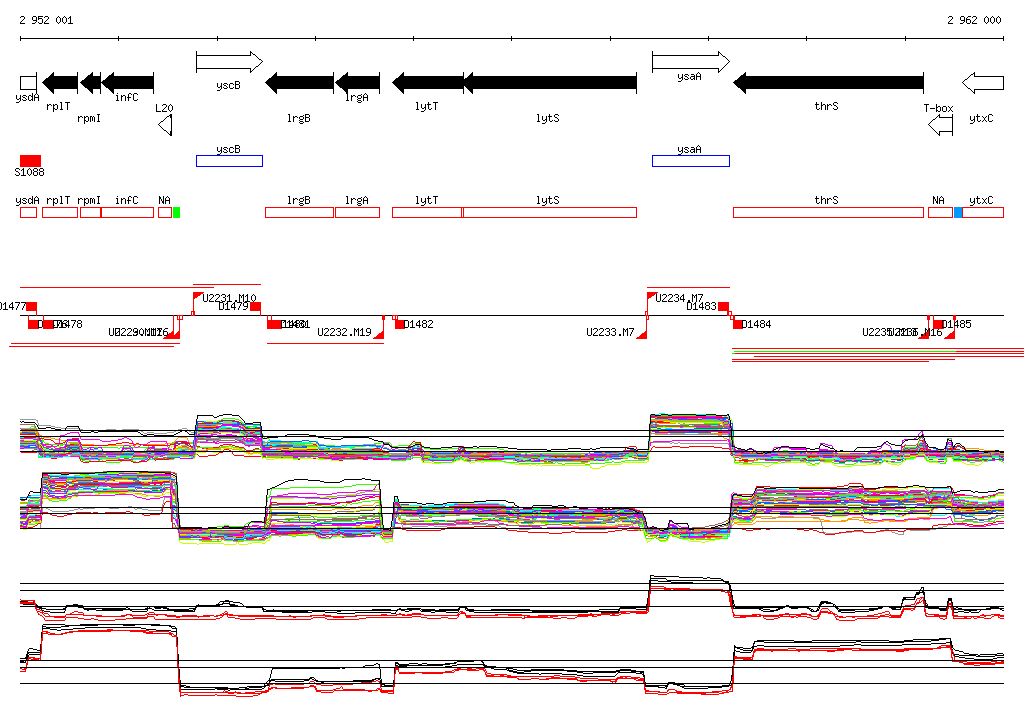
Genomic View of Gene/Segment lytS
Show/Hide
(Legend)
Browse Genome Context