B. subtilis Expression Data Browser
Start Page
B. subtilis Expression Data Browser
Gene/Segment:
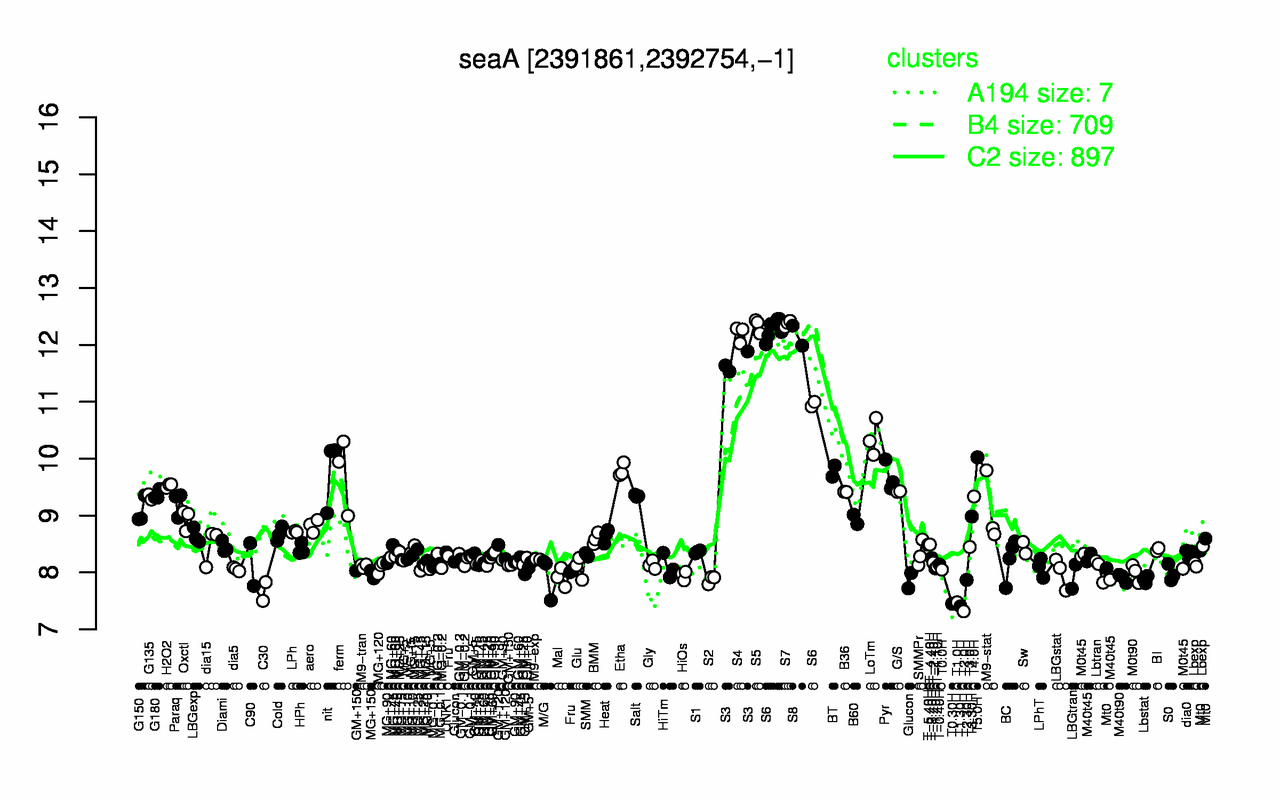
seaA
Locus Tag:
BSU22850
Details about seaA
Show/Hide
Highest Expression Conditions
S7
S5
S4
S8
S6
S3
LoTm
T5.0H
Etha
BT
12.4
12.3
12.2
12.2
12
11.7
10.4
10
9.8
9.78
Lowest Expression Conditions
T2.0H
T1.30H
T0.30H
T1.0H
C30
T2.30H
S2
Lbstat
M40t90
Mal
7.32
7.41
7.45
7.48
7.67
7.87
7.87
7.88
7.9
7.91
Most Positively Correlated Segments
ypzH
yphA
tepA
yqhR
ylzJ
yhfM
gerKA
ykoS
yjaV
ydhD
0.97
0.95
0.93
0.93
0.92
0.92
0.92
0.92
0.92
0.92
Most Negatively Correlated Segments
yugH
yugG
addA
addB
kinC
parB
pbpD
ybeC
bceS
yddK
-0.86
-0.84
-0.84
-0.84
-0.83
-0.83
-0.83
-0.83
-0.83
-0.83
Expression Profile of Segment seaA
Show/Hide
Annotation of Gene seaA
Show/Hide
inference
ab initio prediction:AMIGene:2.0
codon_start
1
product
conserved hypothetical protein
transl_table
11
note
Evidence 4: Homologs of previously reported genes of unknown function
db_xref
GI:2634703
protein_id
CAB14201.1
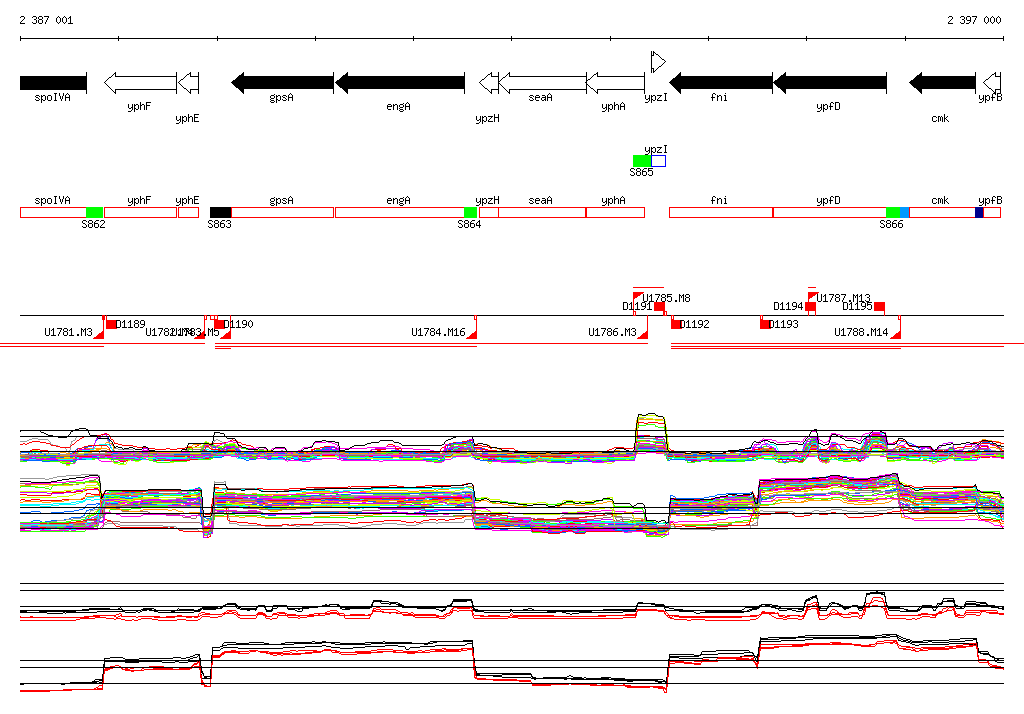
Genomic View of Gene/Segment seaA
Show/Hide
(Legend)
Browse Genome Context