| Start Page |
|
 |
| Start Page |
|
|
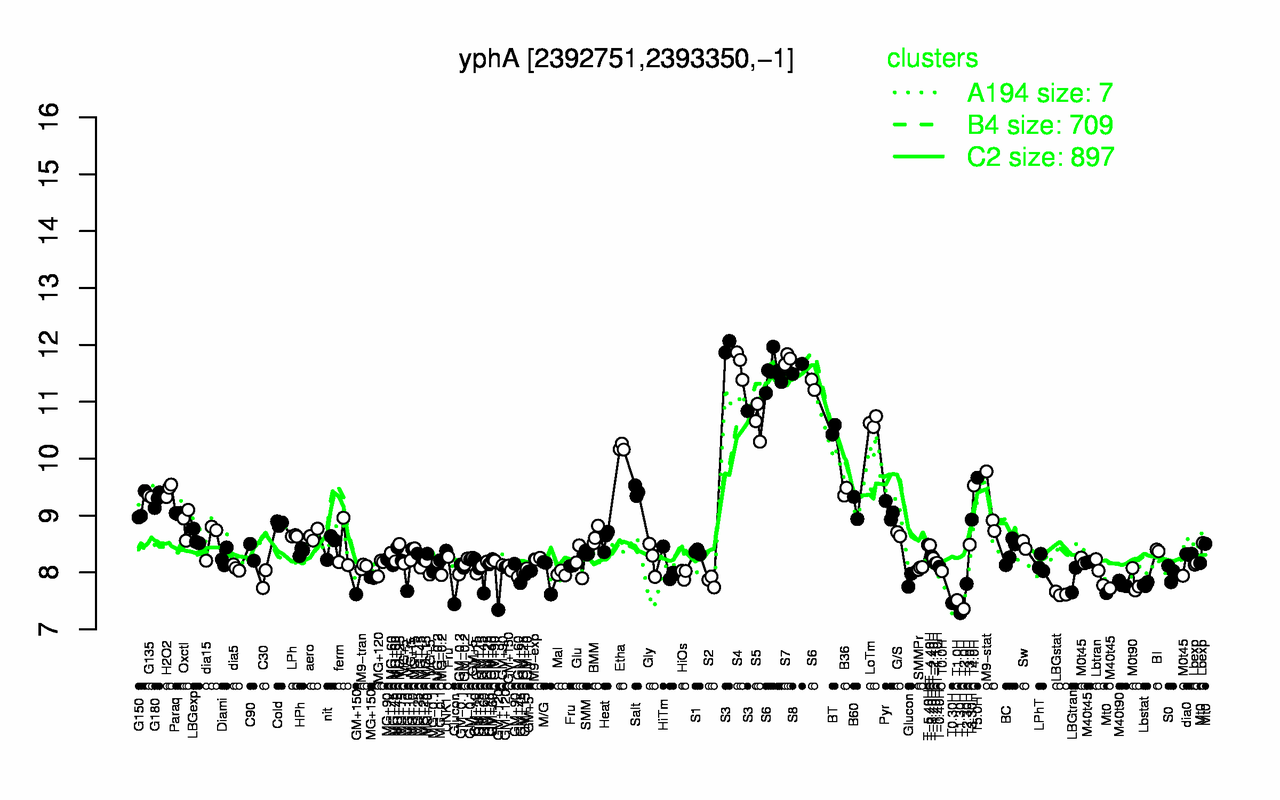
| S7 | S4 | S3 | S8 | S6 | LoTm | S5 | BT | Etha | T5.0H |
| 11.7 | 11.7 | 11.6 | 11.6 | 11.5 | 10.6 | 10.6 | 10.5 | 10.2 | 9.66 |
| T1.30H | T2.0H | T0.30H | T1.0H | LBGstat | GM+120 | Glucon | Lbstat | M40t90 | T2.30H |
| 7.29 | 7.36 | 7.46 | 7.51 | 7.62 | 7.72 | 7.72 | 7.79 | 7.8 | 7.8 |