| Start Page |
|
 |
| Start Page |
|
|
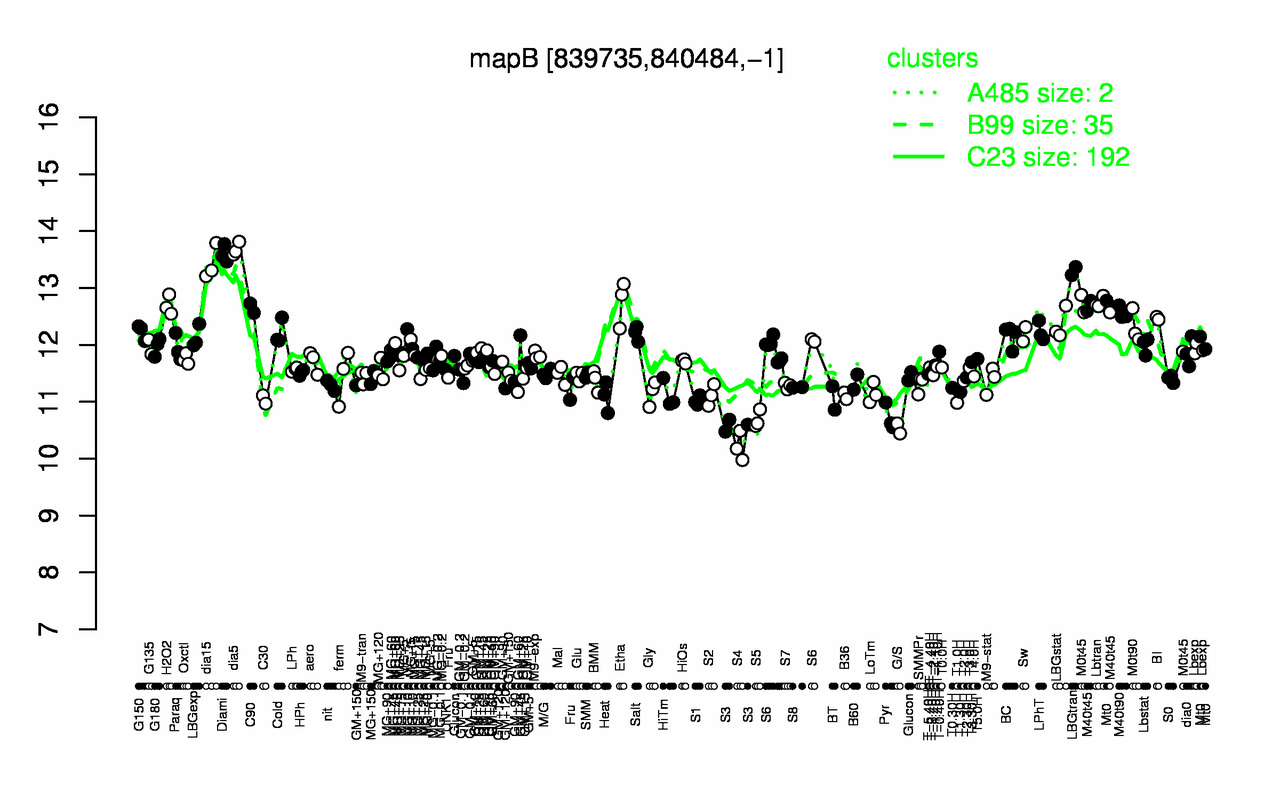
| dia5 | Diami | dia15 | LBGtran | Etha | Lbtran | H2O2 | M40t45 | C90 | M40t90 |
| 13.7 | 13.6 | 13.4 | 13.3 | 12.7 | 12.7 | 12.7 | 12.6 | 12.6 | 12.6 |
| S4 | G/S | S3 | S5 | Pyr | T1.0H | S1 | C30 | BT | Heat |
| 10.2 | 10.5 | 10.6 | 10.7 | 10.7 | 11 | 11 | 11 | 11.1 | 11.1 |