| Start Page |
|
 |
| Start Page |
|
|
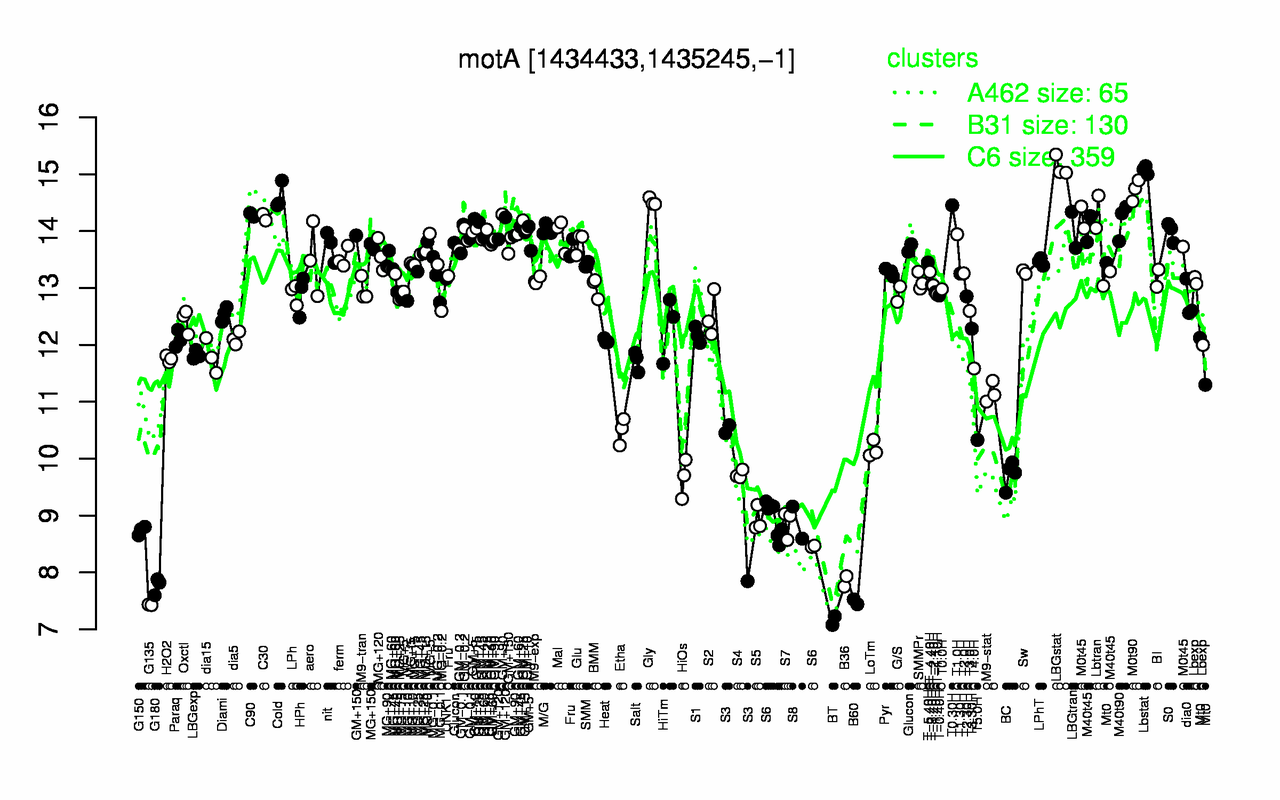
| LBGstat | Lbstat | M0t90 | Cold | Gly | T0.30H | C90 | C30 | M40t90 | GM+10 |
| 15.1 | 15.1 | 14.7 | 14.6 | 14.5 | 14.5 | 14.3 | 14.2 | 14.2 | 14.1 |
| BT | G135 | B60 | G180 | B36 | G150 | S6 | S7 | S8 | S5 |
| 7.15 | 7.43 | 7.48 | 7.77 | 7.84 | 8.74 | 8.83 | 8.87 | 8.88 | 8.93 |