| Start Page |
|
 |
| Start Page |
|
|
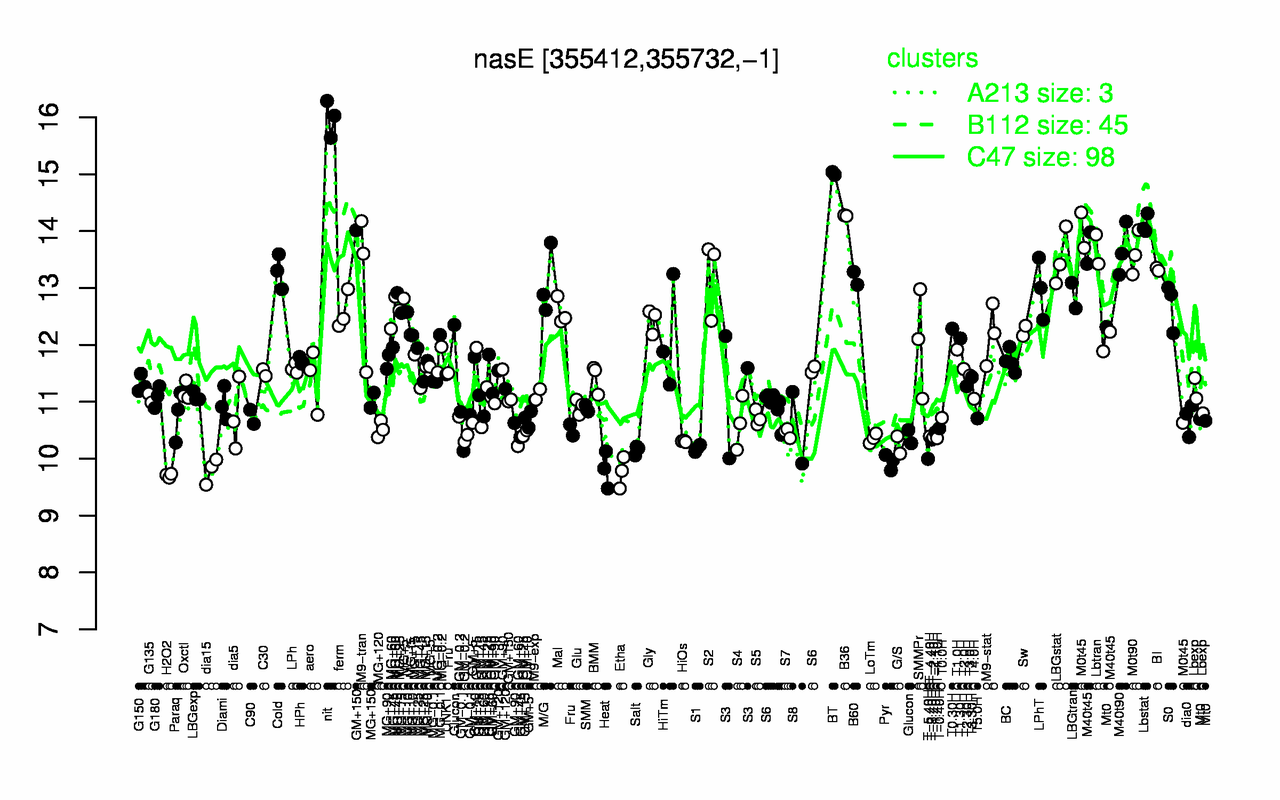
| nit | BT | B36 | Lbstat | M40t90 | M0t90 | LBGstat | BI | Cold | S2 |
| 16 | 15 | 14.3 | 14.1 | 13.7 | 13.6 | 13.5 | 13.3 | 13.3 | 13.2 |
| H2O2 | Etha | dia15 | Heat | Pyr | T-5.40H | Salt | S1 | G/S | HiOs |
| 9.71 | 9.76 | 9.8 | 9.81 | 9.95 | 10 | 10.2 | 10.2 | 10.2 | 10.3 |