| Start Page |
|
 |
| Start Page |
|
|
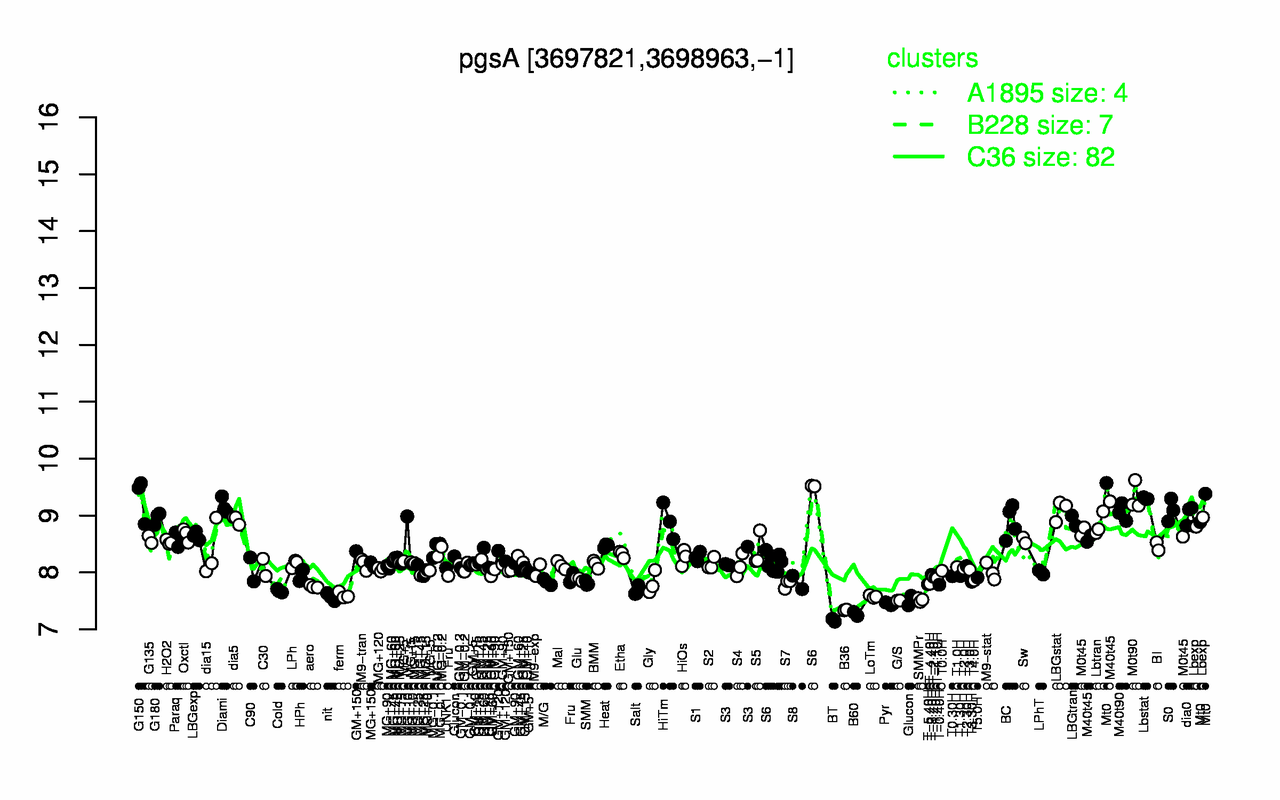
| M0t90 | G150 | Lbstat | Mt0 | Diami | S0 | LBGstat | M40t90 | dia0 | G180 |
| 9.33 | 9.3 | 9.3 | 9.28 | 9.17 | 9.1 | 9.09 | 9.06 | 9.02 | 8.96 |
| BT | B60 | B36 | Pyr | G/S | SMMPr | nit | LoTm | ferm | Cold |
| 7.16 | 7.27 | 7.34 | 7.45 | 7.5 | 7.52 | 7.57 | 7.58 | 7.6 | 7.68 |