| Start Page |
|
 |
| Start Page |
|
|
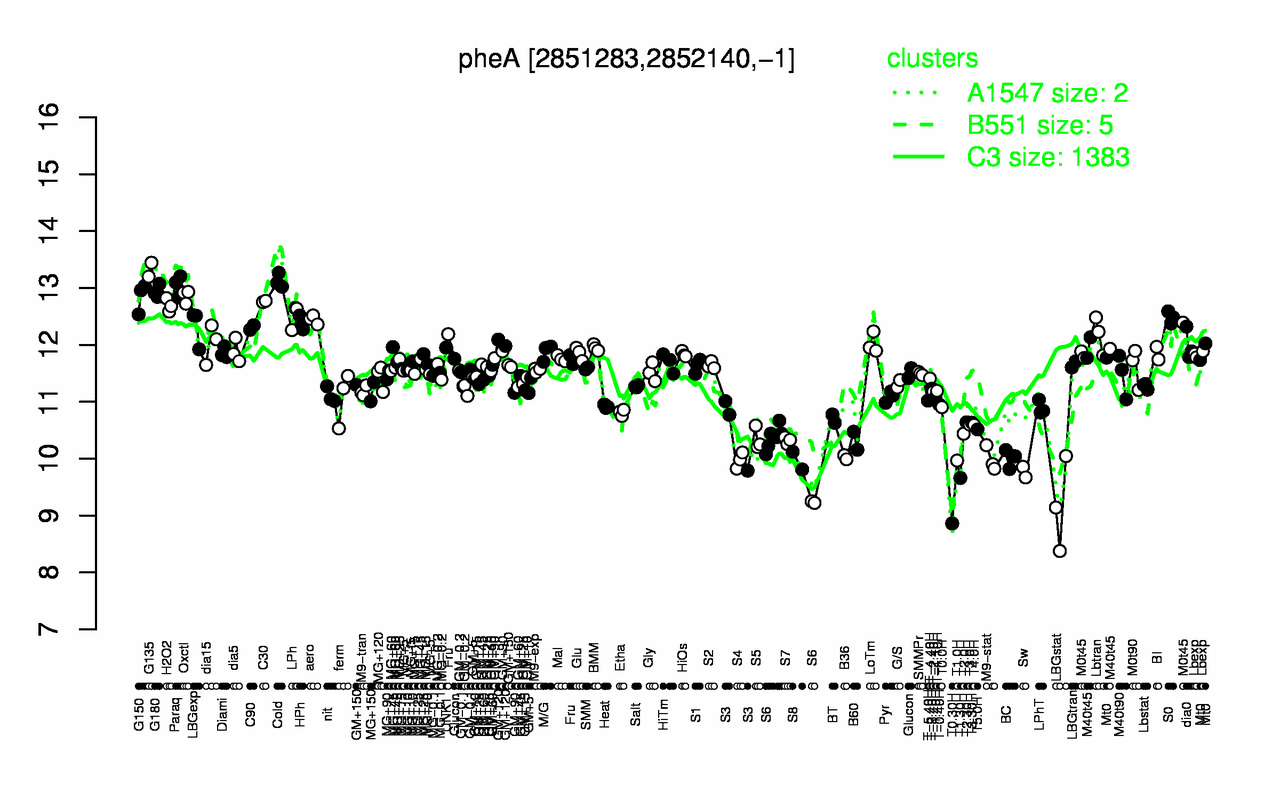
| G135 | Cold | Paraq | G180 | Oxctl | G150 | C30 | H2O2 | LPh | S0 |
| 13.3 | 13.1 | 13 | 12.9 | 12.9 | 12.8 | 12.8 | 12.7 | 12.5 | 12.5 |
| T0.30H | LBGstat | T1.30H | Sw | S8 | T1.0H | S4 | M9-stat | BC | B36 |
| 8.86 | 9.19 | 9.66 | 9.76 | 9.96 | 9.97 | 9.97 | 9.99 | 10 | 10 |