| Start Page |
|
 |
| Start Page |
|
|
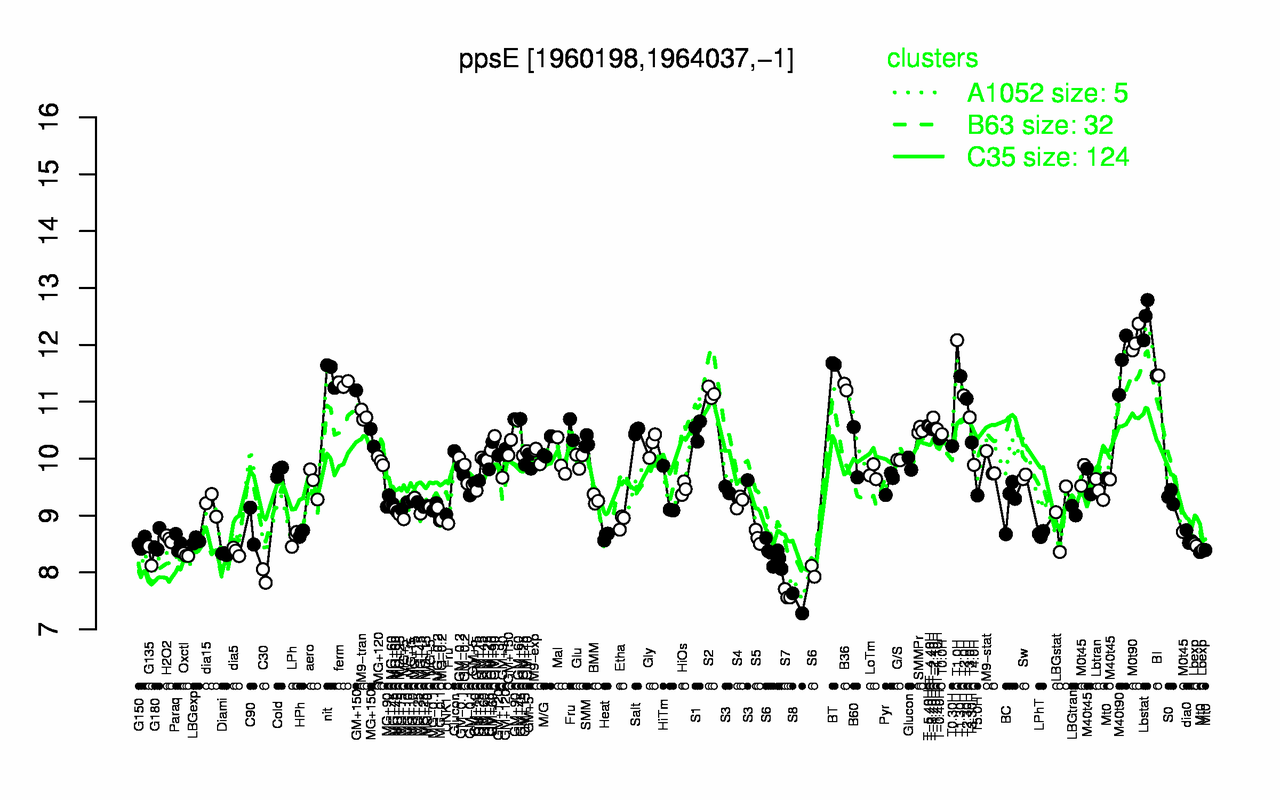
| Lbstat | M0t90 | T1.0H | M40t90 | BT | nit | BI | T1.30H | ferm | B36 |
| 12.5 | 12.1 | 12.1 | 11.7 | 11.7 | 11.5 | 11.5 | 11.5 | 11.3 | 11.3 |
| S8 | S7 | C30 | S6 | G135 | Oxctl | Diami | dia5 | Lbexp | G150 |
| 7.46 | 7.61 | 7.94 | 8.24 | 8.29 | 8.31 | 8.32 | 8.37 | 8.46 | 8.51 |