| Start Page |
|
 |
| Start Page |
|
|
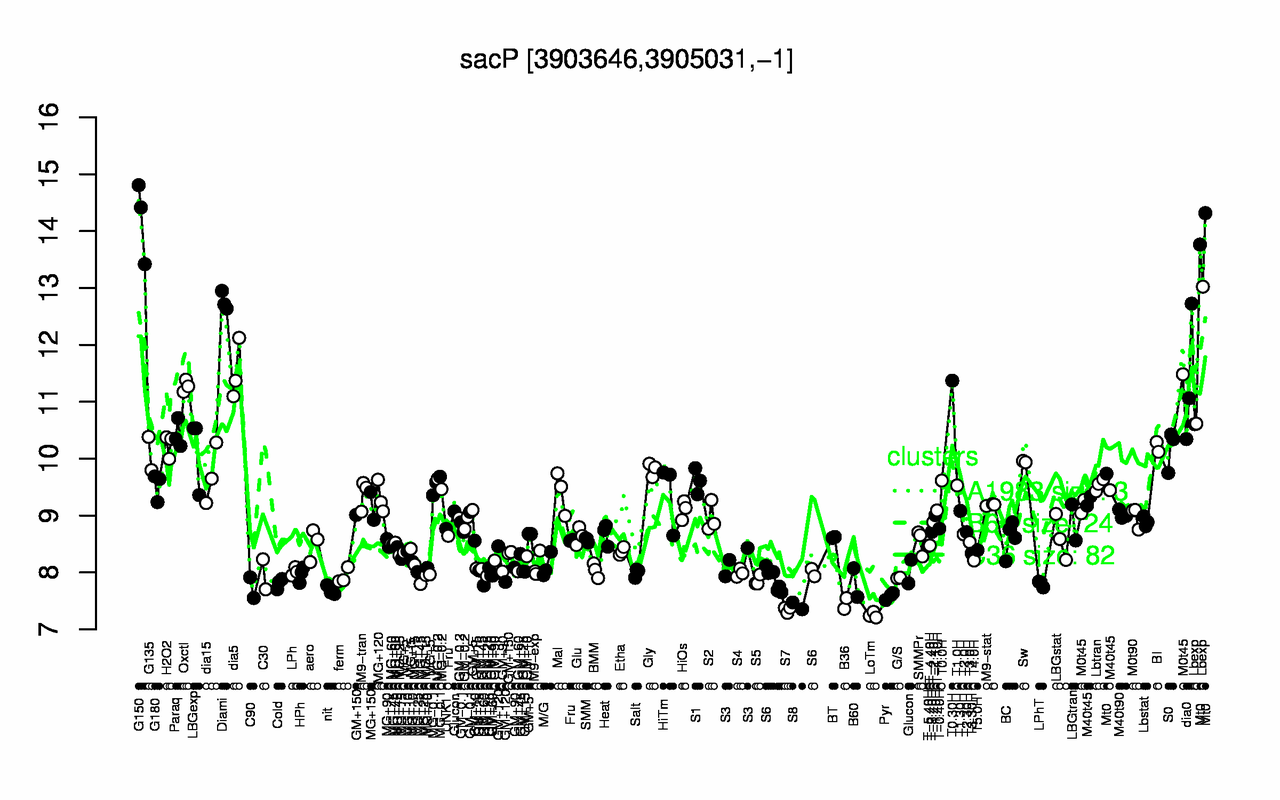
| G150 | Diami | Mt0 | dia5 | Lbexp | dia0 | T0.30H | Oxctl | Paraq | H2O2 |
| 14.2 | 12.8 | 12.6 | 11.5 | 11.4 | 11.4 | 11.4 | 11.3 | 10.4 | 10.2 |
| LoTm | S7 | S8 | B36 | Pyr | nit | C90 | LPhT | Cold | B60 |
| 7.25 | 7.35 | 7.41 | 7.45 | 7.59 | 7.68 | 7.73 | 7.8 | 7.81 | 7.82 |