B. subtilis Expression Data Browser
Start Page
B. subtilis Expression Data Browser
Gene/Segment:
sacY
Locus Tag:
BSU38420
Details about sacY
Show/Hide
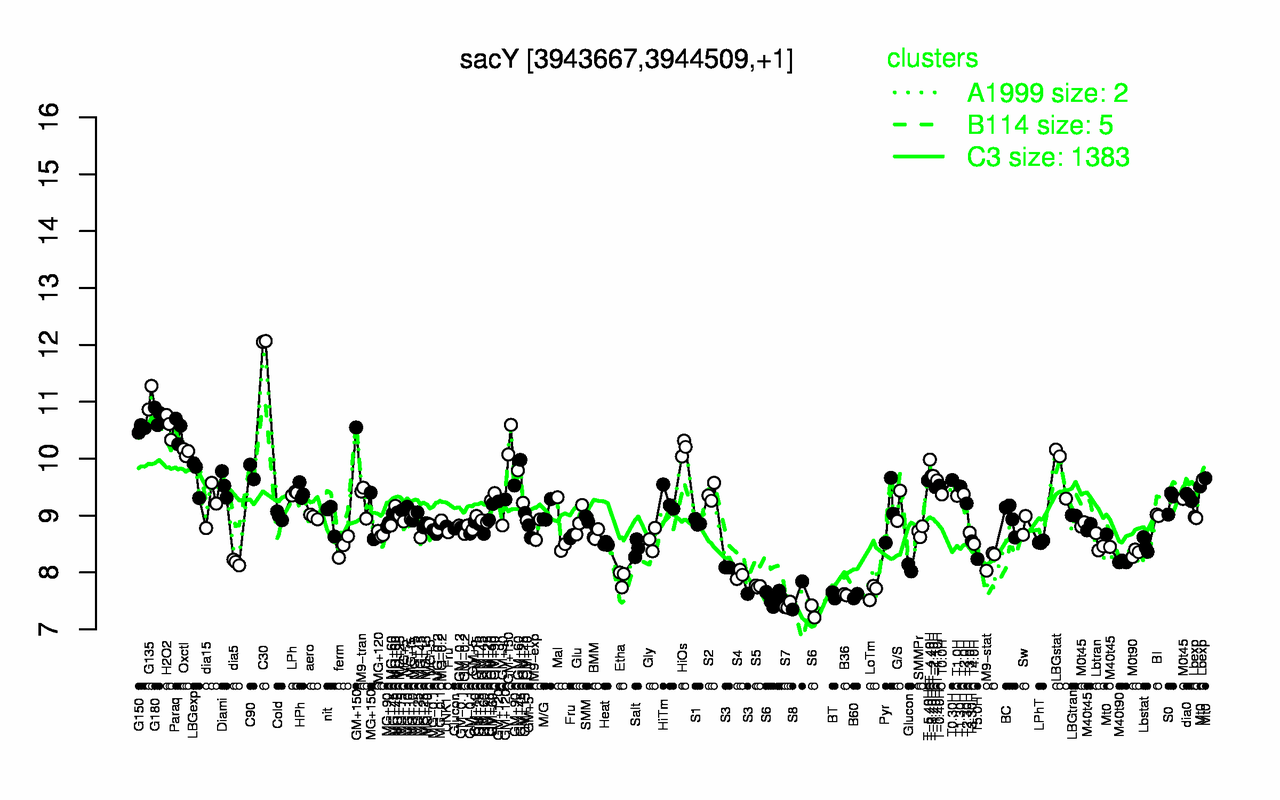
Highest Expression Conditions
C30
G135
G180
H2O2
G150
Paraq
GM+150
HiOs
Oxctl
T-4.40H
12.1
11.1
10.8
10.6
10.5
10.5
10.4
10.2
10.1
9.98
Lowest Expression Conditions
S7
S6
B60
S8
BT
B36
LoTm
S5
Etha
S3
7.42
7.51
7.58
7.6
7.6
7.61
7.66
7.76
7.9
7.93
Most Positively Correlated Segments
sacX
spcB
yckA
ybaR
engD
rsmG
yckB
S1577
S401
scpA
0.95
0.76
0.75
0.75
0.75
0.74
0.74
0.74
0.74
0.74
Most Negatively Correlated Segments
phrI
ymzB
S1246
mpr
ynzL
S1150
phrC
yuaE
ytzE
sinI
-0.68
-0.67
-0.66
-0.64
-0.64
-0.64
-0.64
-0.63
-0.63
-0.62
Expression Profile of Segment sacY
Show/Hide
Annotation of Gene sacY
Show/Hide
function
16.3: Control
inference
ab initio prediction:AMIGene:2.0
codon_start
1
product
transcriptional antiterminator
transl_table
11
note
Evidence 1a: Function experimentally demonstrated in the studied strain; PubMedId: 11580842, 12079345, 15528654, 9305644, 9457872; Product type r: regulator
db_xref
GI:2636377
protein_id
CAB15868.1
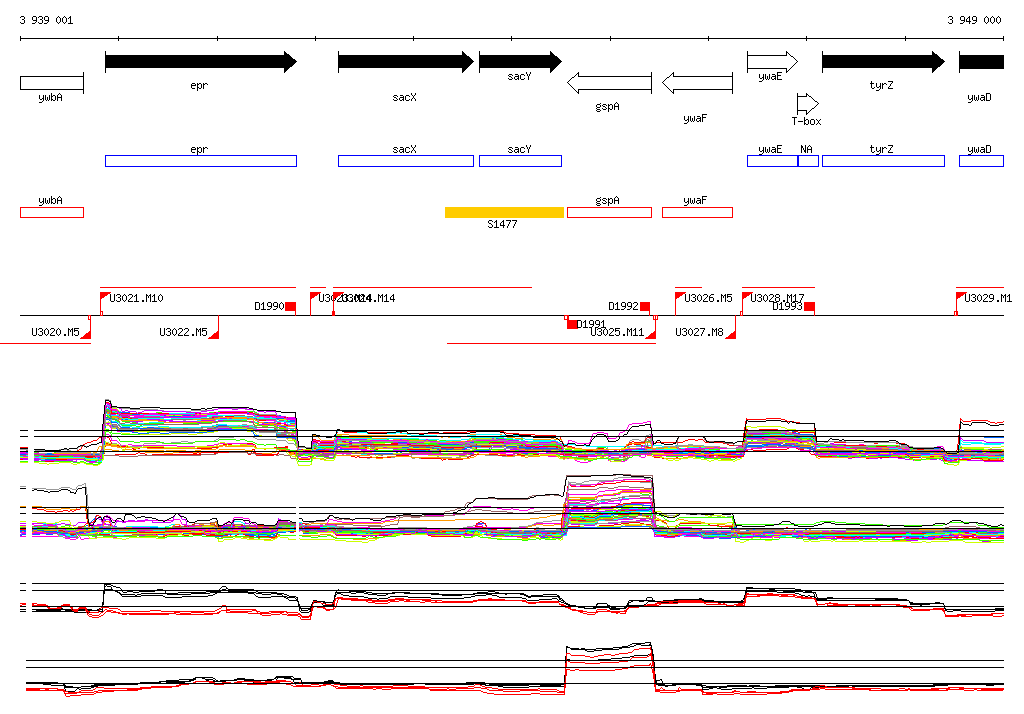
Genomic View of Gene/Segment sacY
Show/Hide
(Legend)
Browse Genome Context