| Start Page |
|
 |
| Start Page |
|
|
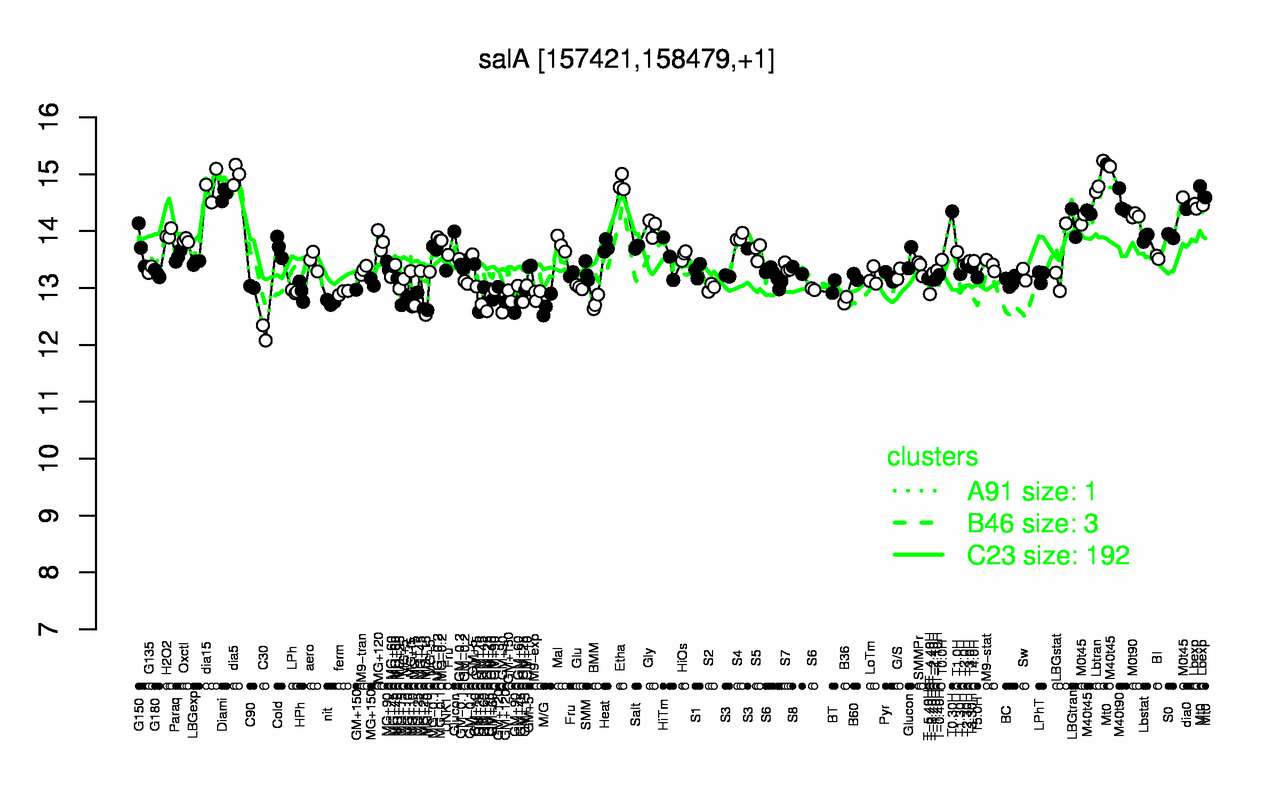
| dia5 | Lbtran | Mt0 | Etha | dia15 | Diami | M40t45 | M40t90 | Lbexp | dia0 |
| 15 | 14.9 | 14.9 | 14.8 | 14.8 | 14.6 | 14.6 | 14.5 | 14.4 | 14.4 |
| C30 | MG+15 | GM+25 | M/G | GM+90 | MG+10 | BMM | nit | GM+45 | B36 |
| 12.2 | 12.6 | 12.6 | 12.7 | 12.7 | 12.7 | 12.7 | 12.8 | 12.8 | 12.8 |