| Start Page |
|
 |
| Start Page |
|
|
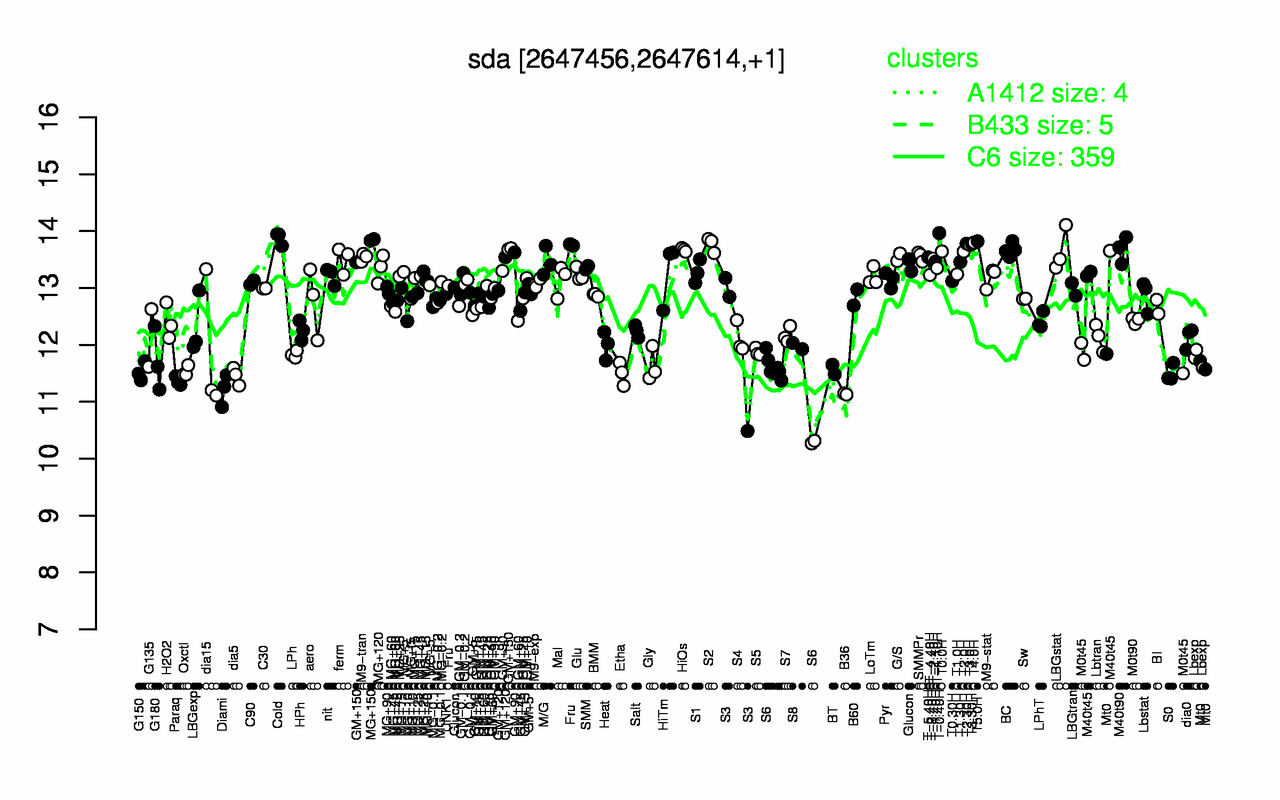
| T-0.40H | Cold | MG+150 | T5.0H | T4.0H | T2.30H | T3.30H | S2 | T3.0H | M40t90 |
| 14 | 13.9 | 13.8 | 13.8 | 13.8 | 13.8 | 13.8 | 13.8 | 13.8 | 13.7 |
| B36 | Diami | S6 | Paraq | dia5 | Etha | S0 | G150 | Oxctl | BT |
| 11.1 | 11.2 | 11.3 | 11.4 | 11.5 | 11.5 | 11.5 | 11.5 | 11.5 | 11.6 |