| Start Page |
|
 |
| Start Page |
|
|
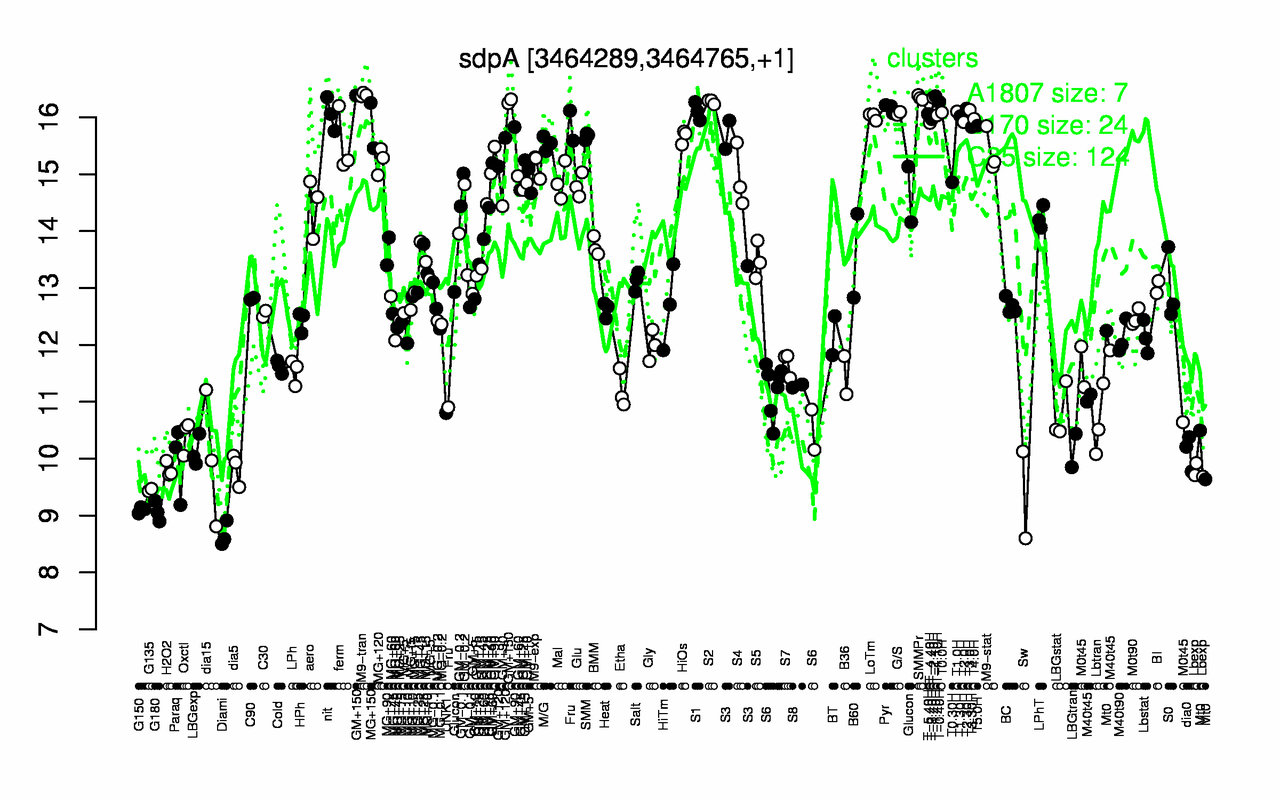
| M9-tran | T-1.40H | T-2.40H | SMMPr | GM+150 | S2 | T-0.40H | Pyr | T2.30H | T3.0H |
| 16.4 | 16.4 | 16.3 | 16.3 | 16.3 | 16.3 | 16.3 | 16.2 | 16.2 | 16.1 |
| Diami | G180 | G150 | Sw | G135 | Lbexp | H2O2 | dia5 | Paraq | dia15 |
| 8.67 | 9.07 | 9.1 | 9.36 | 9.45 | 9.77 | 9.81 | 9.83 | 9.95 | 10 |