B. subtilis Expression Data Browser
Start Page
B. subtilis Expression Data Browser
Gene/Segment:
sodA
Locus Tag:
BSU25020
Details about sodA
Show/Hide
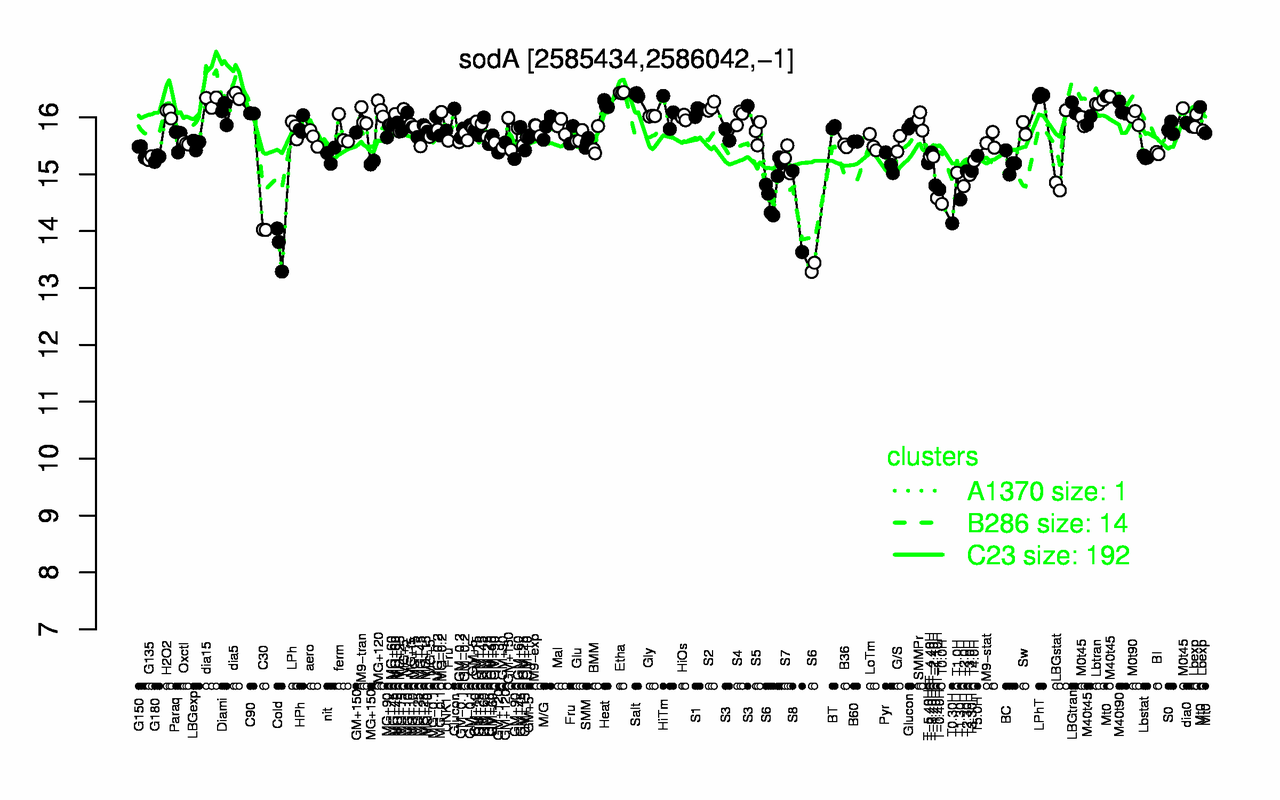
Highest Expression Conditions
Etha
Salt
LPhT
dia5
dia15
Lbtran
Heat
S2
LBGtran
MG+120
16.4
16.4
16.4
16.4
16.3
16.3
16.2
16.2
16.2
16.1
Lowest Expression Conditions
Cold
C30
T0.30H
S8
S6
T0.0H
T1.30H
T-1.10H
T-0.40H
T2.0H
13.7
14
14.1
14.3
14.5
14.5
14.6
14.6
14.7
14.8
Most Positively Correlated Segments
groEL
ypwA
tpx
groES
ampS
S209
yqiW
ykzC
gndA
zwf
0.76
0.76
0.75
0.74
0.73
0.7
0.7
0.67
0.67
0.67
Most Negatively Correlated Segments
S1182
ykzO
S651
S790
S1237
yyzB
S739
S1482
S962
S58
-0.6
-0.56
-0.55
-0.55
-0.54
-0.53
-0.53
-0.53
-0.52
-0.52
Expression Profile of Segment sodA
Show/Hide
Annotation of Gene sodA
Show/Hide
function
16.11: Scavenge (Catabolism)
function
16.8: Protect
inference
ab initio prediction:AMIGene:2.0
codon_start
1
EC_number
1.15.1.1
transl_table
11
note
Evidence 1a: Function experimentally demonstrated in the studied strain; PubMedId: 10074093, 15897454, 18084079, 9393707, 9573176, 9658017; Product type e : enzyme
db_xref
GI:225185195
product
superoxide dismutase
protein_id
CAB14432.3
Genomic View of Gene/Segment sodA
Show/Hide
(Legend)
Browse Genome Context