B. subtilis Expression Data Browser
Start Page
B. subtilis Expression Data Browser
Gene/Segment:
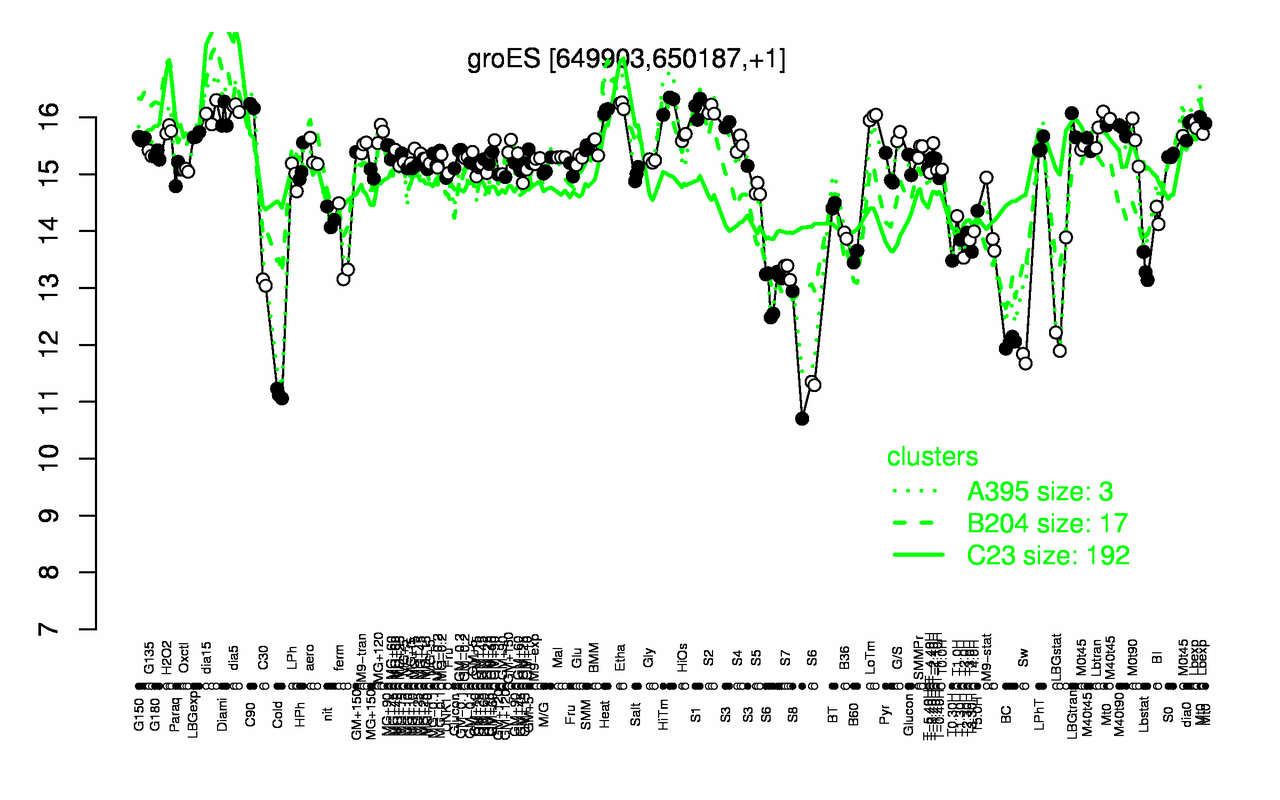
groES
Locus Tag:
BSU06020
Details about groES
Show/Hide
Highest Expression Conditions
HiTm
Etha
C90
dia5
S1
S2
Heat
dia15
LoTm
Diami
16.2
16.2
16.2
16.2
16.2
16.1
16.1
16.1
16
16
Lowest Expression Conditions
Cold
Sw
S8
BC
S6
LBGstat
C30
S7
Lbstat
T0.30H
11.1
11.8
11.8
12
12.6
12.7
13.1
13.3
13.4
13.5
Most Positively Correlated Segments
groEL
S209
ampS
grpE
hbs
gndA
pncA
dnaK
dapH
pncB
0.94
0.86
0.8
0.78
0.76
0.76
0.76
0.75
0.75
0.75
Most Negatively Correlated Segments
des
yqfW
fadR
hutM
S1517
hutG
S995
S1237
spoIISB
fadB
-0.64
-0.63
-0.61
-0.6
-0.59
-0.59
-0.59
-0.59
-0.59
-0.59
Expression Profile of Segment groES
Show/Hide
Annotation of Gene groES
Show/Hide
function
16.6: Maintain
function
16.13: Shape
inference
ab initio prediction:AMIGene:2.0
codon_start
1
product
chaperonin small subunit
transl_table
11
note
Evidence 1a: Function experimentally demonstrated in the studied strain; PubMedId: 11407116, 17031040, 9303302; Product type f: factor
db_xref
GI:32468706
protein_id
CAB12421.2
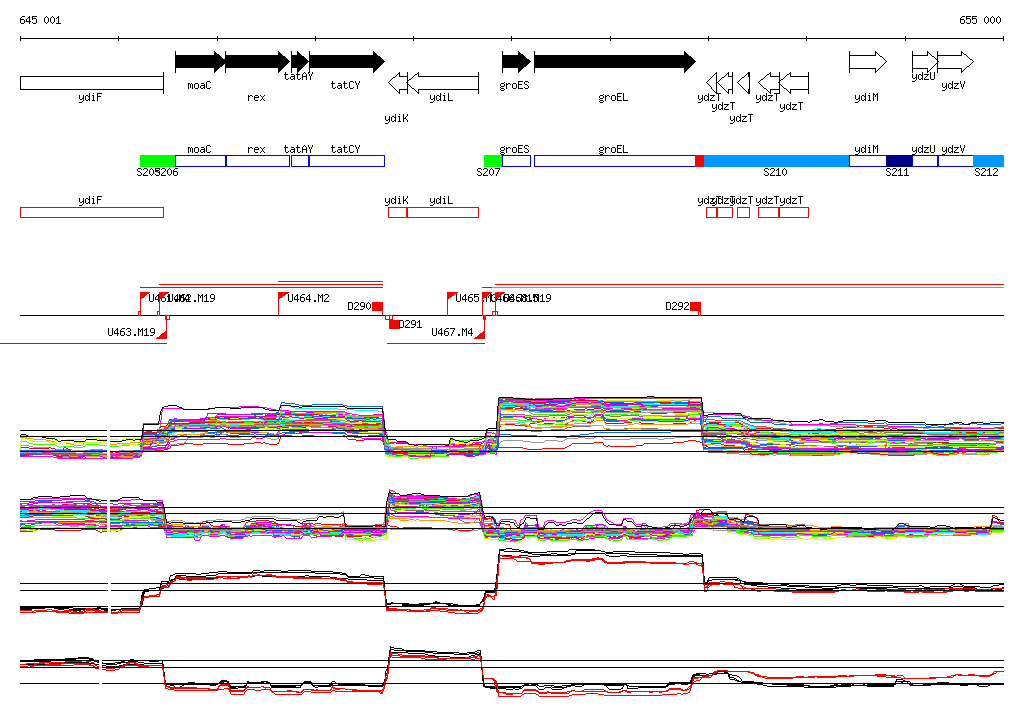
Genomic View of Gene/Segment groES
Show/Hide
(Legend)
Browse Genome Context