| Start Page |
|
 |
| Start Page |
|
|
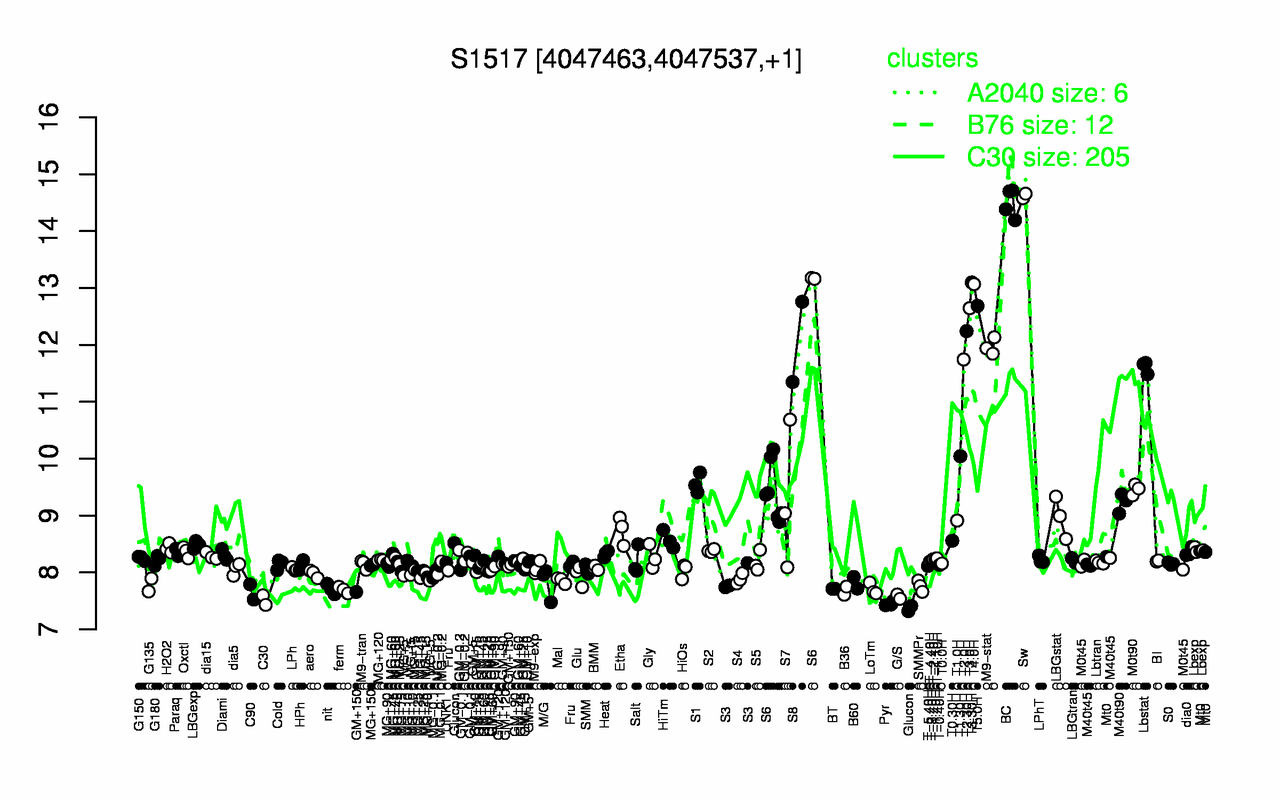
| Sw | BC | T3.30H | T4.0H | T5.0H | T3.0H | T2.30H | S8 | M9-stat | T2.0H |
| 14.6 | 14.5 | 13.1 | 13.1 | 12.7 | 12.6 | 12.2 | 12.1 | 12 | 11.7 |
| Pyr | C30 | G/S | C90 | B36 | ferm | LoTm | nit | BT | Glucon |
| 7.45 | 7.51 | 7.57 | 7.66 | 7.68 | 7.69 | 7.7 | 7.71 | 7.71 | 7.75 |