| Start Page |
|
 |
| Start Page |
|
|
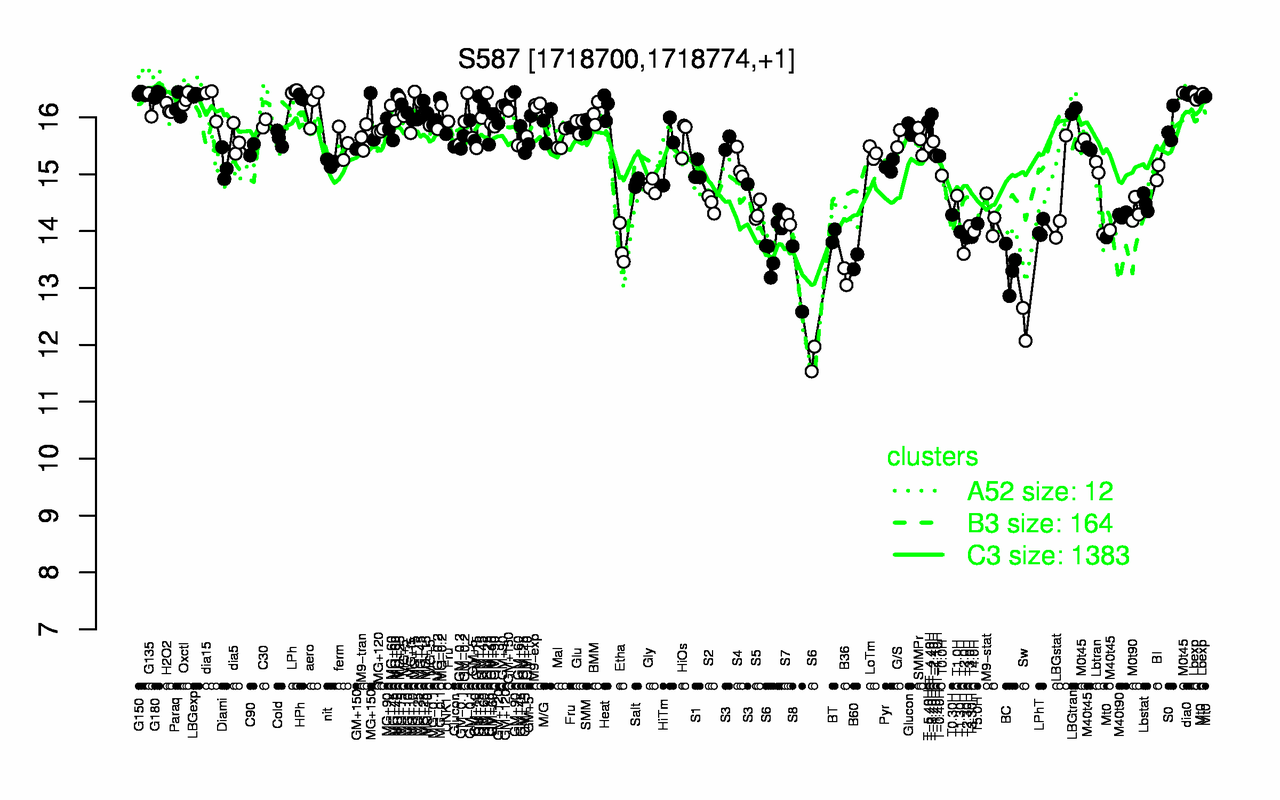
| LPh | dia0 | G150 | G180 | LBGexp | Lbexp | HPh | Oxctl | dia15 | MG+15 |
| 16.5 | 16.4 | 16.4 | 16.4 | 16.4 | 16.4 | 16.3 | 16.3 | 16.3 | 16.3 |
| Sw | S8 | B36 | S6 | BC | B60 | T2.0H | Etha | T2.30H | T3.30H |
| 12.4 | 13.2 | 13.2 | 13.4 | 13.4 | 13.5 | 13.6 | 13.7 | 13.9 | 13.9 |