B. subtilis Expression Data Browser
Start Page
B. subtilis Expression Data Browser
Gene/Segment:
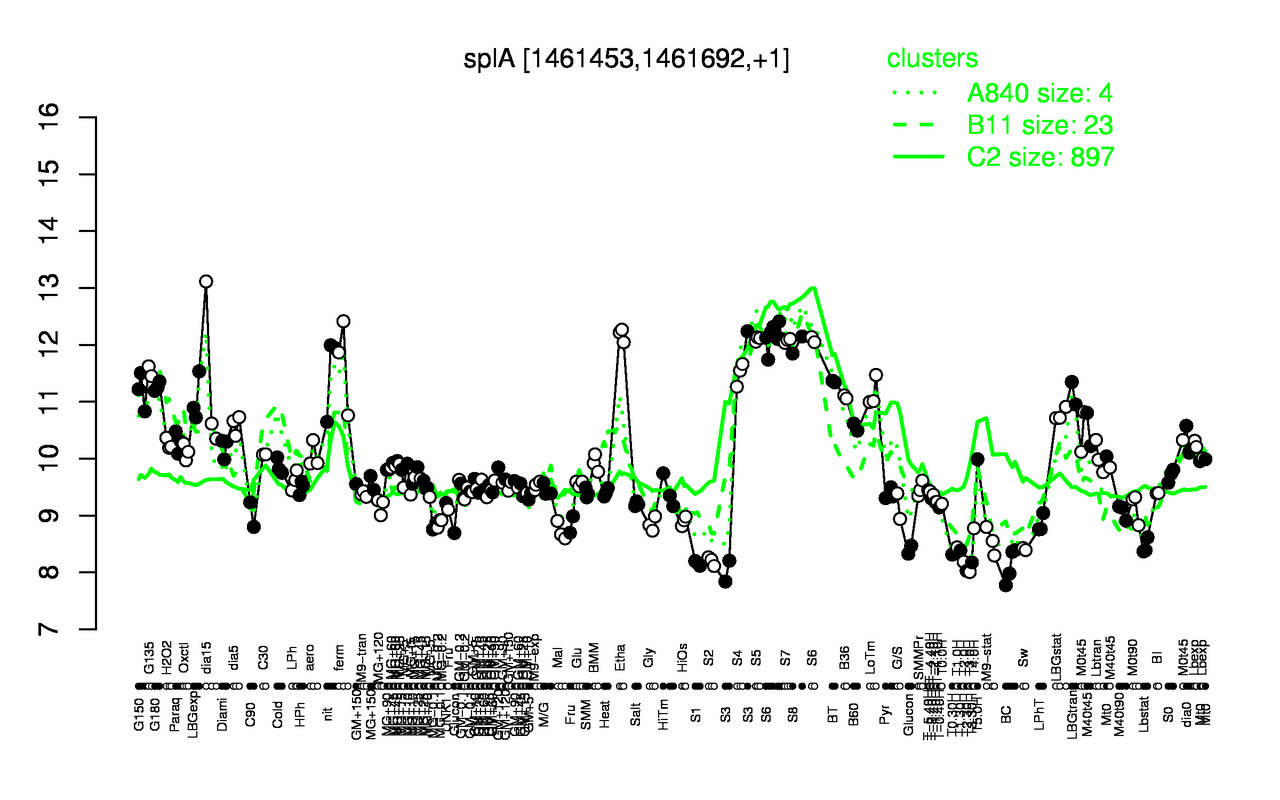
splA
Locus Tag:
BSU13920
Details about splA
Show/Hide
Highest Expression Conditions
Etha
S6
S5
S7
S8
ferm
G135
nit
S4
dia15
12.2
12.1
12.1
12.1
12
11.7
11.5
11.5
11.5
11.4
Lowest Expression Conditions
T3.0H
T2.30H
BC
S1
T3.30H
T2.0H
S2
T0.30H
T1.30H
Sw
8.01
8.03
8.13
8.16
8.18
8.19
8.2
8.31
8.39
8.41
Most Positively Correlated Segments
splB
S1198
yhcB
yhbJ
yhcA
ylzJ
tepA
yqgO
yqgE
ywoC
0.98
0.83
0.81
0.8
0.8
0.8
0.8
0.79
0.78
0.78
Most Negatively Correlated Segments
pycA
ypmR
yvbK
yjcL
S712
ypjP
citS
pksB
yobF
sigH
-0.77
-0.69
-0.69
-0.69
-0.68
-0.68
-0.68
-0.68
-0.67
-0.67
Expression Profile of Segment splA
Show/Hide
Annotation of Gene splA
Show/Hide
function
16.3: Control
inference
ab initio prediction:AMIGene:2.0
codon_start
1
product
TRAP-like transcriptional regulator
transl_table
11
note
Evidence 1a: Function experimentally demonstrated in the studied strain; PubMedId: 10629212, 9009064, 9323362; Product type r: regulator
db_xref
GI:2633763
protein_id
CAB13265.1
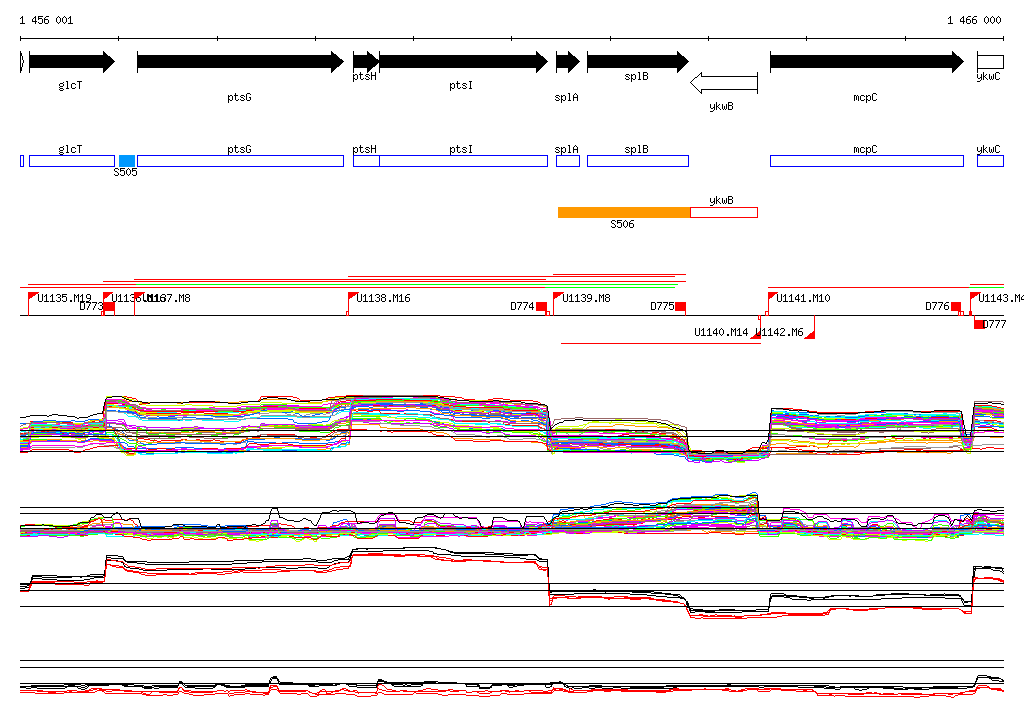
Genomic View of Gene/Segment splA
Show/Hide
(Legend)
Browse Genome Context