| Start Page |
|
 |
| Start Page |
|
|
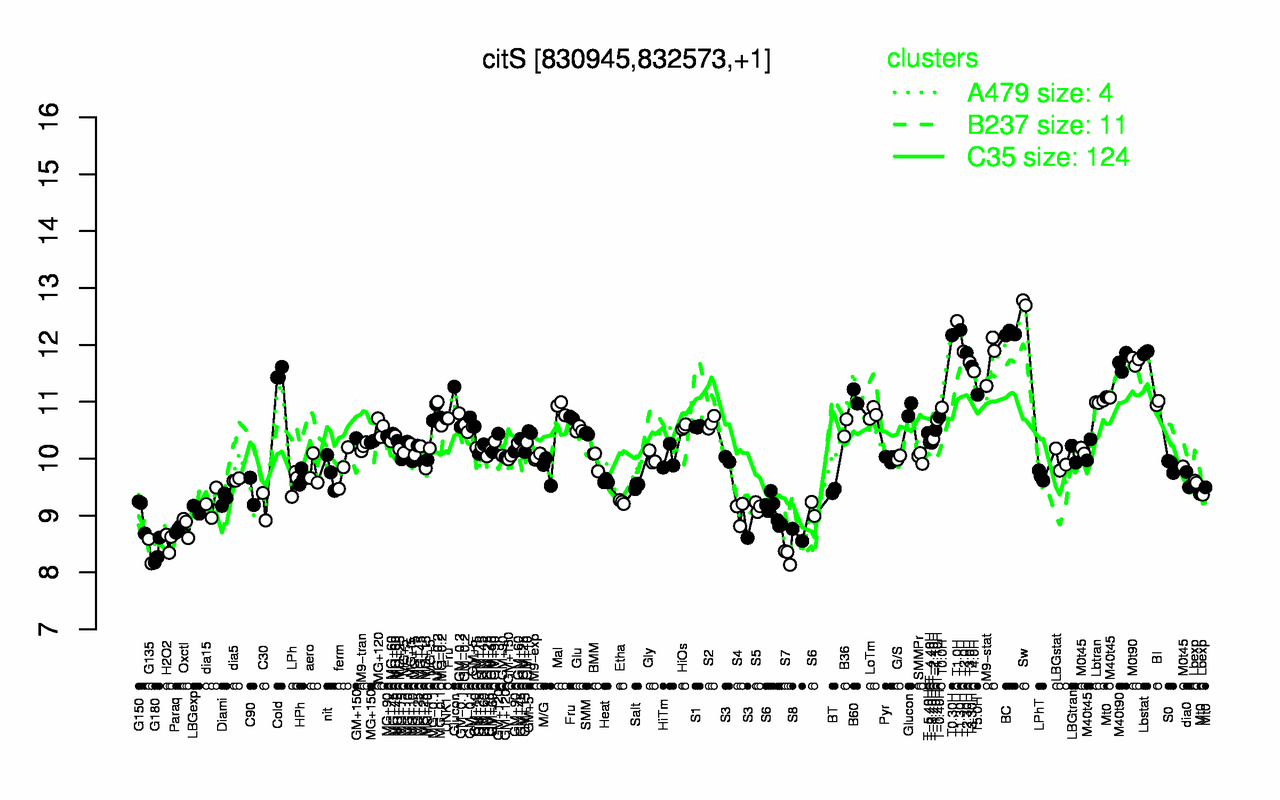
| Sw | T1.0H | T1.30H | BC | T0.30H | T2.0H | Lbstat | T2.30H | M9-stat | M0t90 |
| 12.7 | 12.4 | 12.3 | 12.2 | 12.2 | 11.9 | 11.9 | 11.9 | 11.8 | 11.7 |
| S7 | G180 | G135 | H2O2 | S8 | Paraq | Oxctl | G150 | S4 | S6 |
| 8.29 | 8.35 | 8.37 | 8.54 | 8.66 | 8.76 | 8.81 | 9.05 | 9.06 | 9.08 |