| Start Page |
|
 |
| Start Page |
|
|
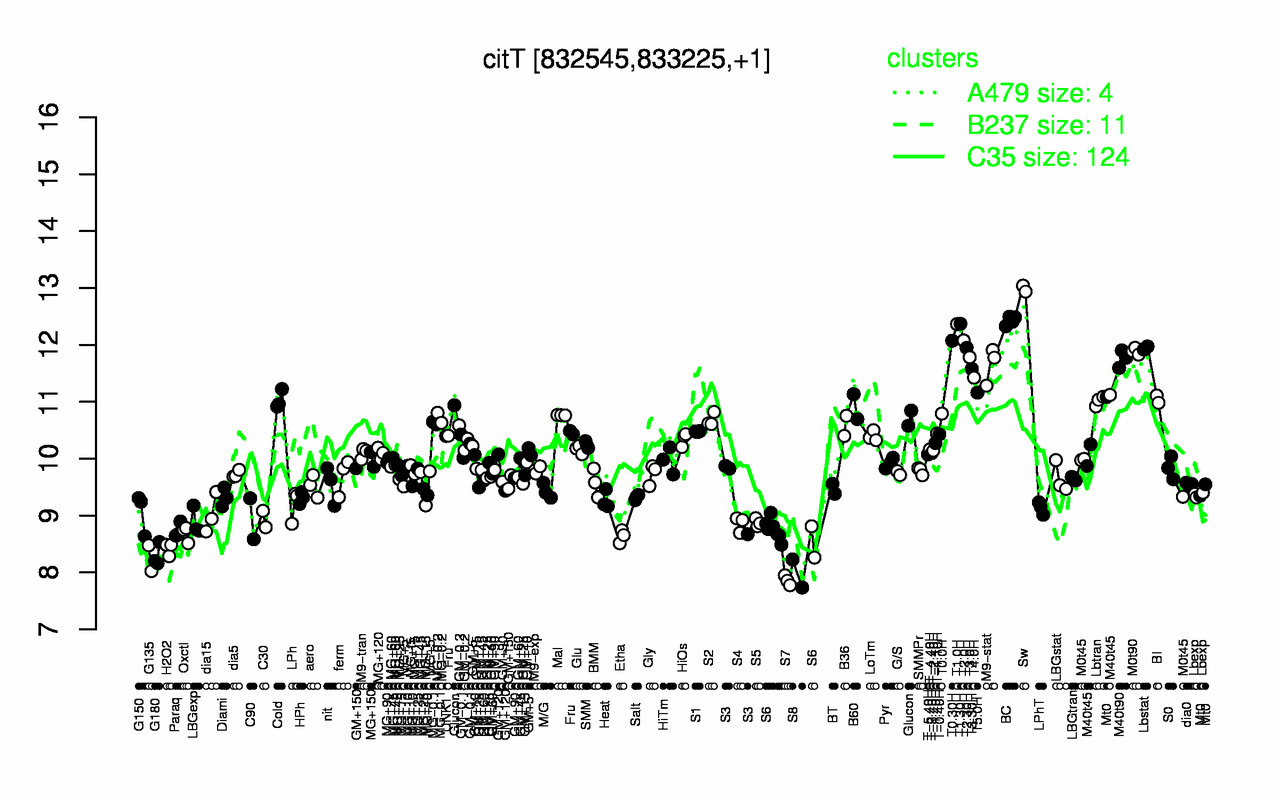
| Sw | BC | T1.30H | T1.0H | T2.0H | T0.30H | T2.30H | Lbstat | M0t90 | T3.0H |
| 13 | 12.4 | 12.4 | 12.4 | 12.1 | 12.1 | 12 | 11.9 | 11.9 | 11.8 |
| S7 | S8 | G135 | G180 | H2O2 | Etha | Oxctl | S6 | Paraq | S4 |
| 7.86 | 7.98 | 8.25 | 8.3 | 8.42 | 8.64 | 8.68 | 8.71 | 8.74 | 8.86 |