B. subtilis Expression Data Browser
Start Page
B. subtilis Expression Data Browser
Gene/Segment:
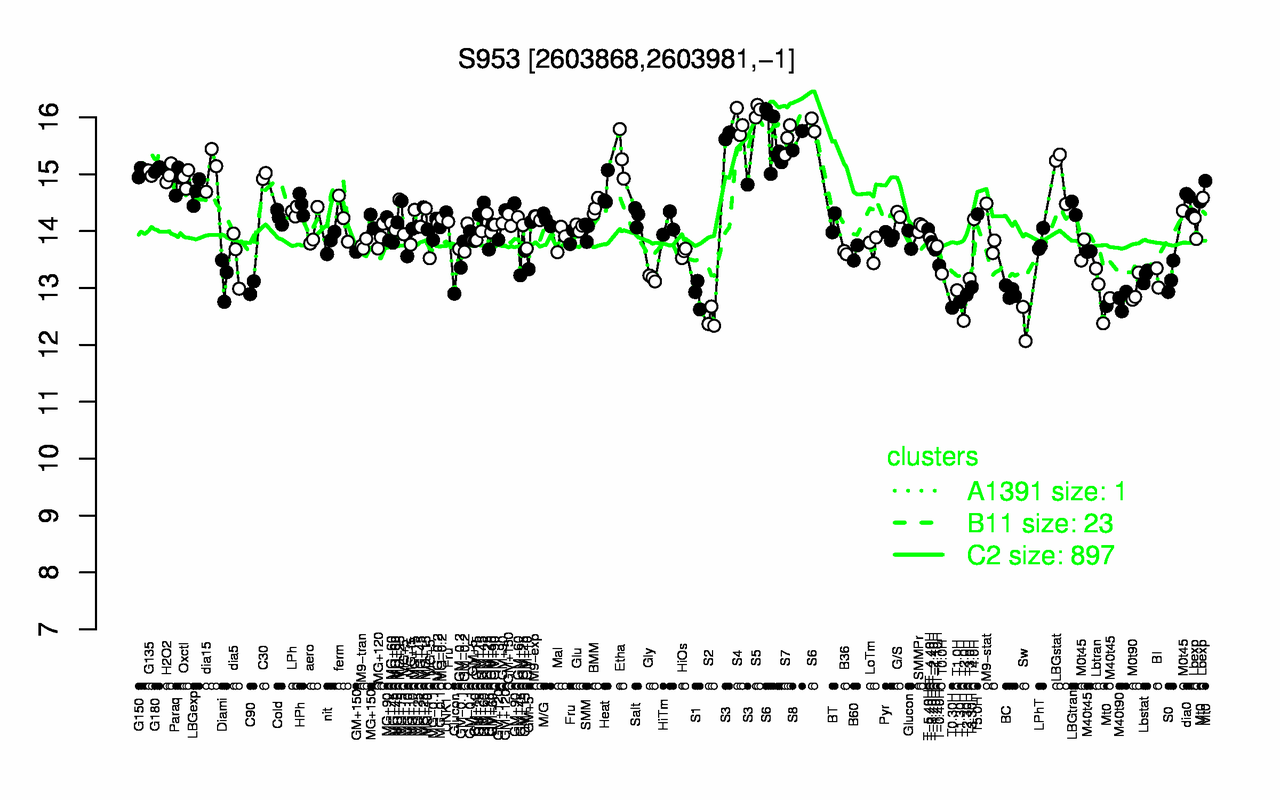
S953
Locus Tag:
new_2603868_2603981_c
Details about S953
Show/Hide
Highest Expression Conditions
S5
S4
S6
S7
S8
S3
Etha
dia15
G180
G150
16.1
15.9
15.7
15.6
15.6
15.4
15.3
15.1
15.1
15
Lowest Expression Conditions
Sw
T2.0H
S2
T0.30H
T1.30H
M40t90
T2.30H
S1
BC
Lbtran
12.4
12.4
12.5
12.7
12.8
12.8
12.9
12.9
12.9
12.9
Most Positively Correlated Segments
S1065
mlpA
S1198
yhcB
yptA
yhbJ
S592
S662
yhcA
yhcC
0.77
0.77
0.76
0.74
0.74
0.74
0.73
0.73
0.73
0.72
Most Negatively Correlated Segments
citT
oppC
oppB
oppD
oppF
yflP
cimH
citS
kinD
ftsZ
-0.75
-0.75
-0.75
-0.74
-0.74
-0.73
-0.73
-0.73
-0.72
-0.7
Expression Profile of Segment S953
Show/Hide
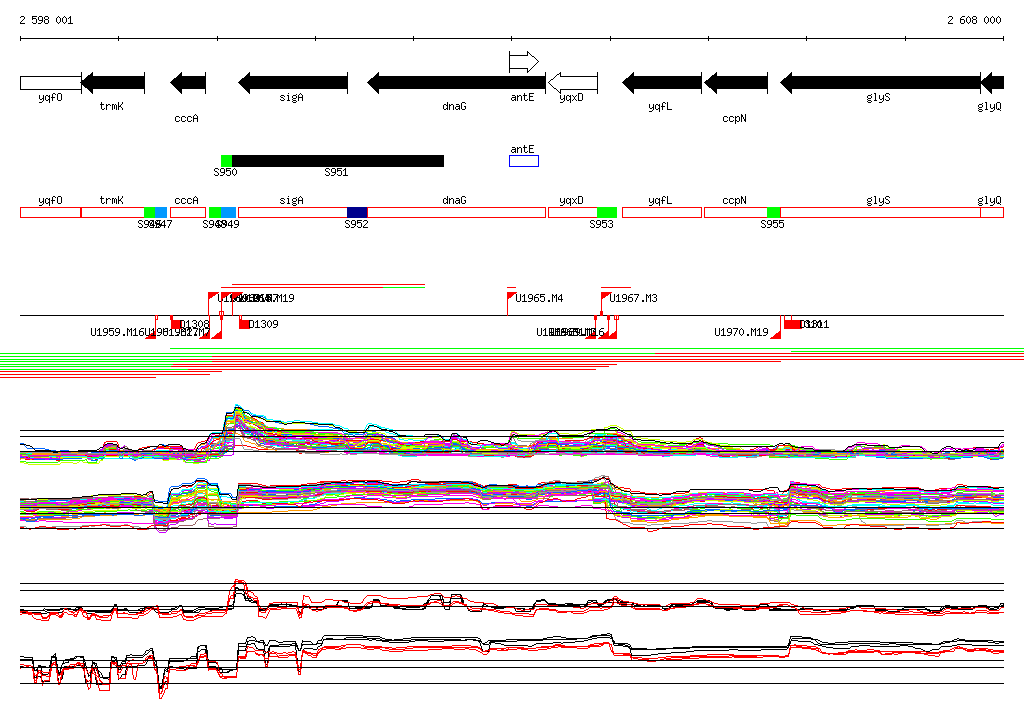
Genomic View of Gene/Segment S953
Show/Hide
(Legend)
Browse Genome Context