| Start Page |
|
 |
| Start Page |
|
|
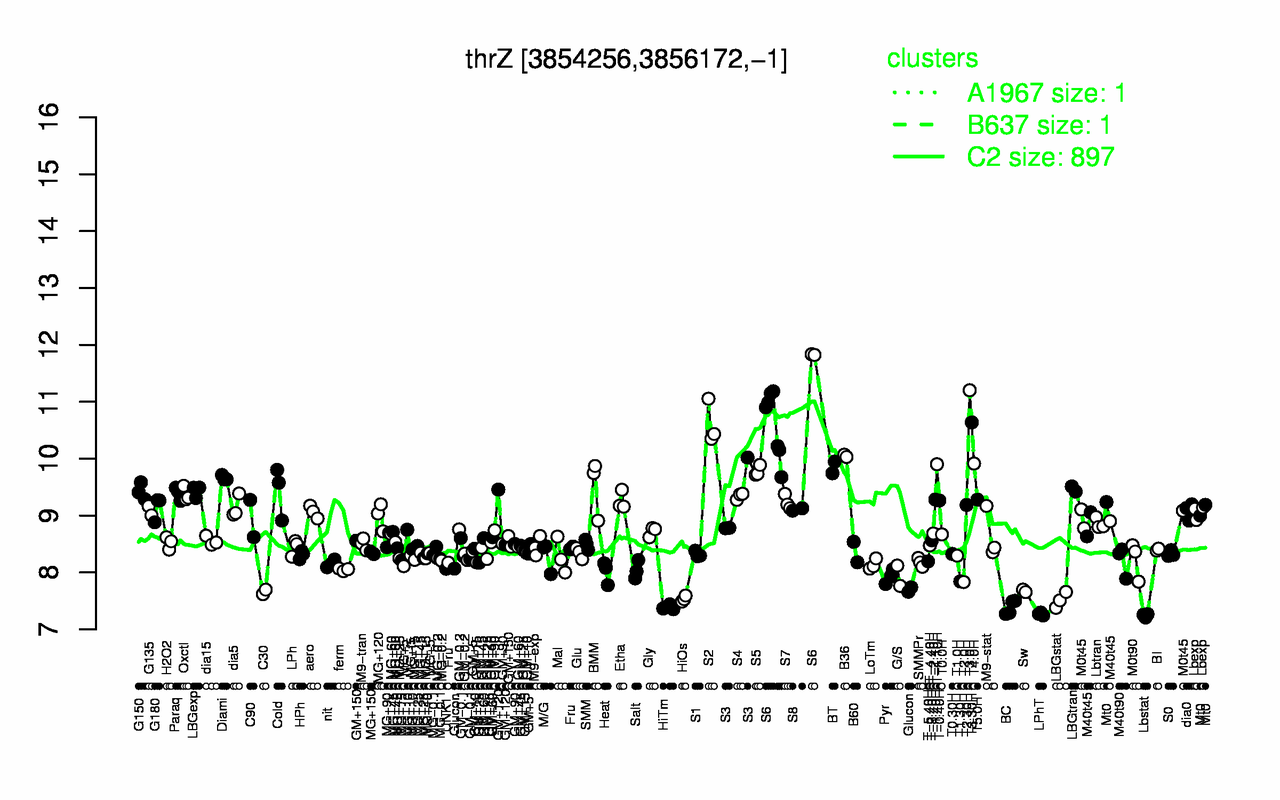
| T3.0H | S6 | T3.30H | S2 | B36 | T4.0H | T-1.10H | BT | S5 | Diami |
| 11.2 | 10.9 | 10.6 | 10.6 | 10 | 9.91 | 9.9 | 9.85 | 9.78 | 9.66 |
| Lbstat | LPhT | HiTm | BC | LBGstat | HiOs | C30 | Sw | Glucon | T2.0H |
| 7.24 | 7.27 | 7.39 | 7.39 | 7.51 | 7.54 | 7.66 | 7.68 | 7.82 | 7.83 |