| Start Page |
|
 |
| Start Page |
|
|
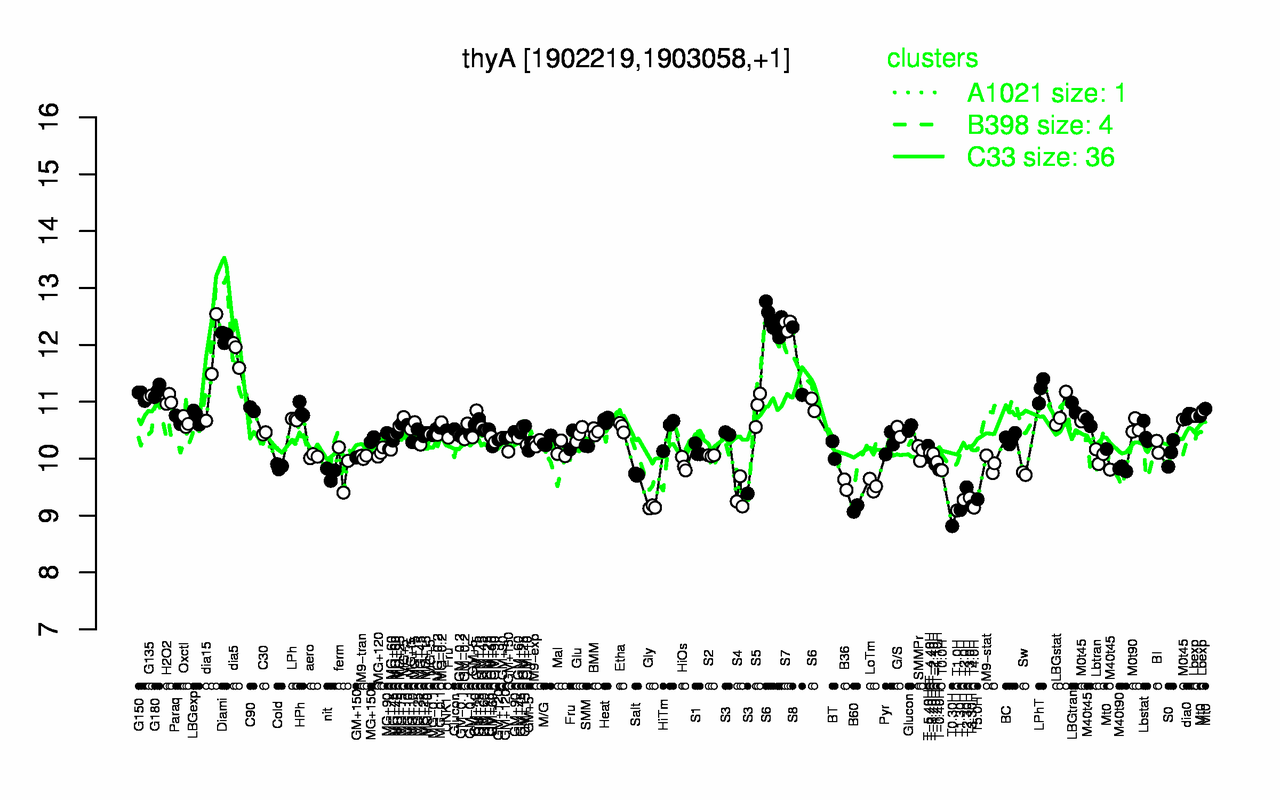
| S7 | Diami | S6 | dia5 | S8 | dia15 | LPhT | G180 | G150 | G135 |
| 12.3 | 12.1 | 12.1 | 11.9 | 11.7 | 11.6 | 11.2 | 11.2 | 11.1 | 11.1 |
| T0.30H | T1.0H | T1.30H | B60 | T4.0H | Gly | T3.30H | T2.0H | T5.0H | T3.0H |
| 8.82 | 9.09 | 9.1 | 9.12 | 9.14 | 9.15 | 9.17 | 9.27 | 9.29 | 9.31 |