B. subtilis Expression Data Browser
Details about tkt Show/Hide
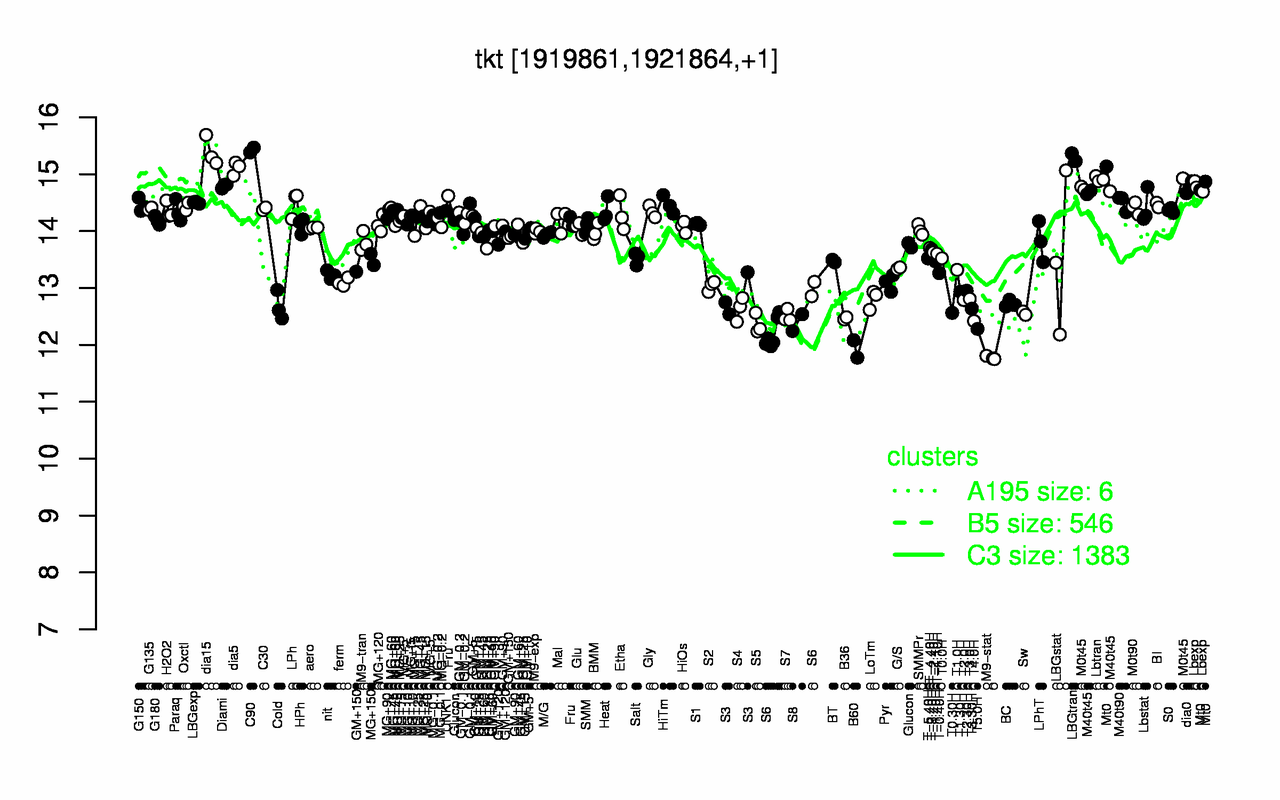
Highest Expression Conditions
C90 dia15 LBGtran dia5 Lbtran Mt0 M0t45 Diami Lbexp dia0
15.4 15.4 15.3 15.1 14.9 14.9 14.8 14.8 14.8 14.8
Lowest Expression Conditions
M9-stat B60 T5.0H S5 S8 S6 T4.0H B36 S7 Sw
11.8 11.9 12.3 12.4 12.4 12.4 12.4 12.5 12.5 12.6
Most Positively Correlated Segments
patB yqgX yutF metS leuS yvrG pgi menB glyS fabL
0.89 0.89 0.88 0.85 0.85 0.84 0.84 0.84 0.83 0.83
Most Negatively Correlated Segments
yjdH yttP spoIVA mpr ywcI sigG S1467 S653 skfA S862
-0.79 -0.79 -0.79 -0.79 -0.79 -0.78 -0.78 -0.78 -0.78 -0.78
Expression Profile of Segment tkt Show/Hide
Annotation of Gene tkt Show/Hide
function
16.2: Construct biomass (Anabolism)
inference
ab initio prediction:AMIGene:2.0
codon_start
1
EC_number
2.2.1.1
transl_table
11
note
Evidence 1a: Function experimentally demonstrated in the studied strain; PubMedId: 12682299, 12882400; Product type e: enzyme
db_xref
GI:2634173
product
transketolase
protein_id
CAB13673.1
Genomic View of Gene/Segment tkt Show/Hide
(Legend)