| Start Page |
|
 |
| Start Page |
|
|
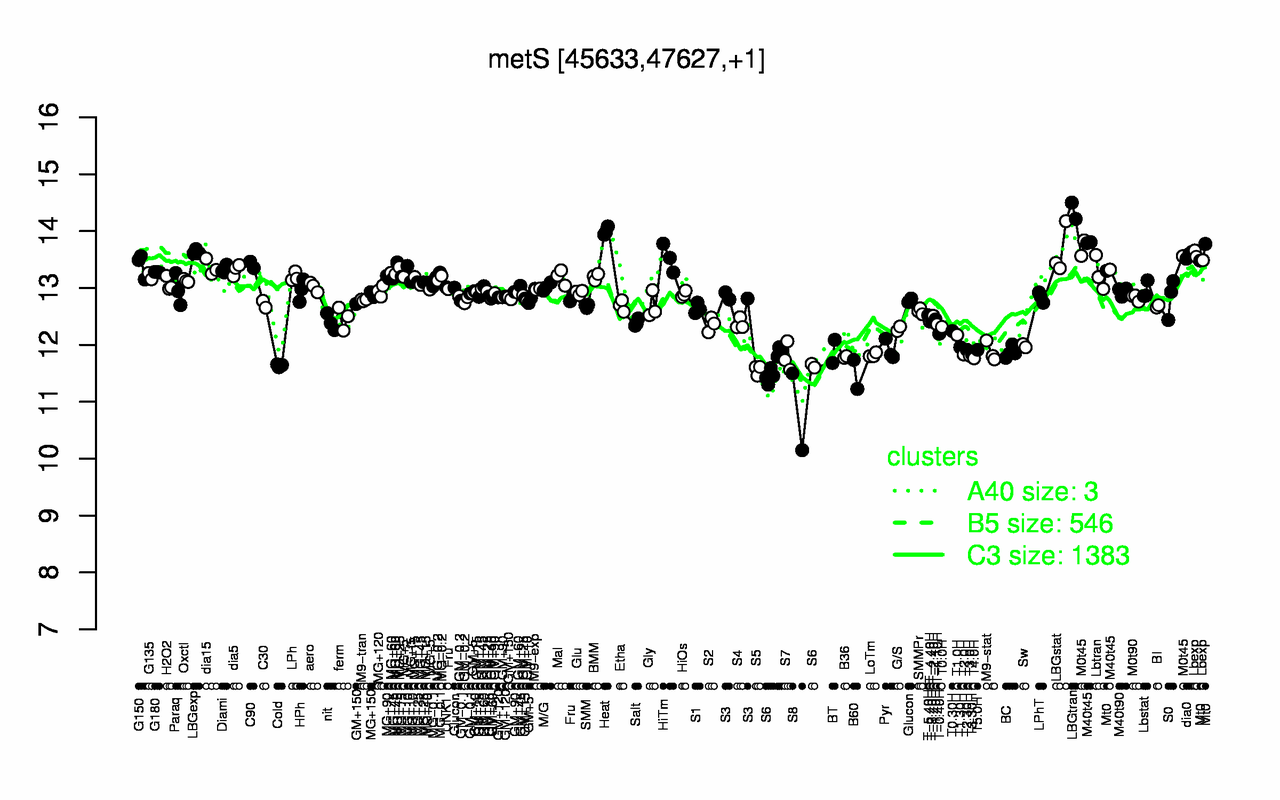
| LBGtran | Heat | LBGstat | M0t45 | M40t45 | LBGexp | dia0 | Lbexp | HiTm | Mt0 |
| 14.4 | 14 | 13.7 | 13.7 | 13.6 | 13.6 | 13.6 | 13.6 | 13.5 | 13.5 |
| S8 | B60 | S5 | S6 | Cold | T4.0H | S7 | B36 | T3.0H | LoTm |
| 10.8 | 11.5 | 11.6 | 11.6 | 11.6 | 11.8 | 11.8 | 11.8 | 11.8 | 11.8 |