| Start Page |
|
 |
| Start Page |
|
|
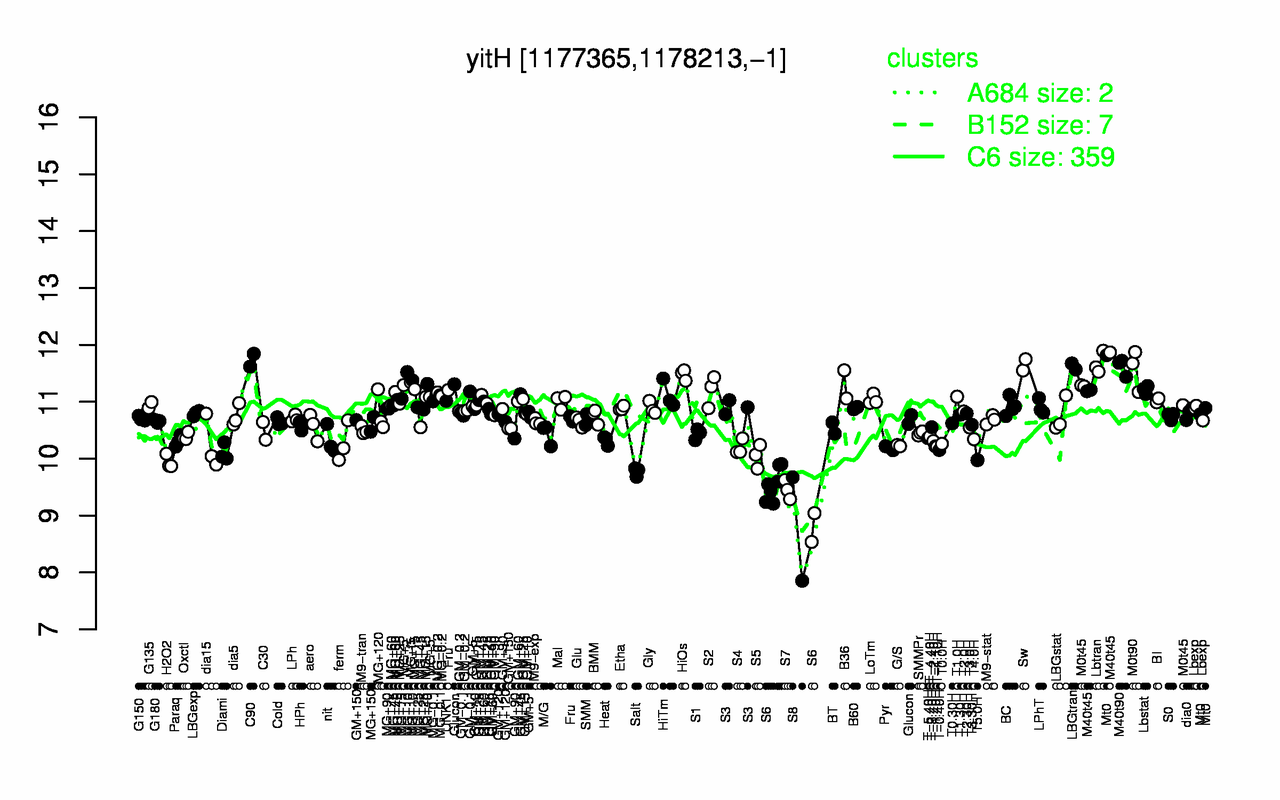
| C90 | Lbtran | Sw | LBGtran | M40t90 | M0t90 | HiOs | M40t45 | MG+10 | MG+t5 |
| 11.7 | 11.7 | 11.6 | 11.6 | 11.6 | 11.6 | 11.5 | 11.4 | 11.4 | 11.3 |
| S8 | S6 | S7 | Salt | H2O2 | T5.0H | S5 | Diami | T-0.40H | Pyr |
| 8.76 | 9.38 | 9.45 | 9.77 | 9.94 | 9.97 | 10 | 10.1 | 10.2 | 10.2 |