B. subtilis Expression Data Browser
Start Page
B. subtilis Expression Data Browser
Gene/Segment:
ylmE
Locus Tag:
BSU15380
Details about ylmE
Show/Hide
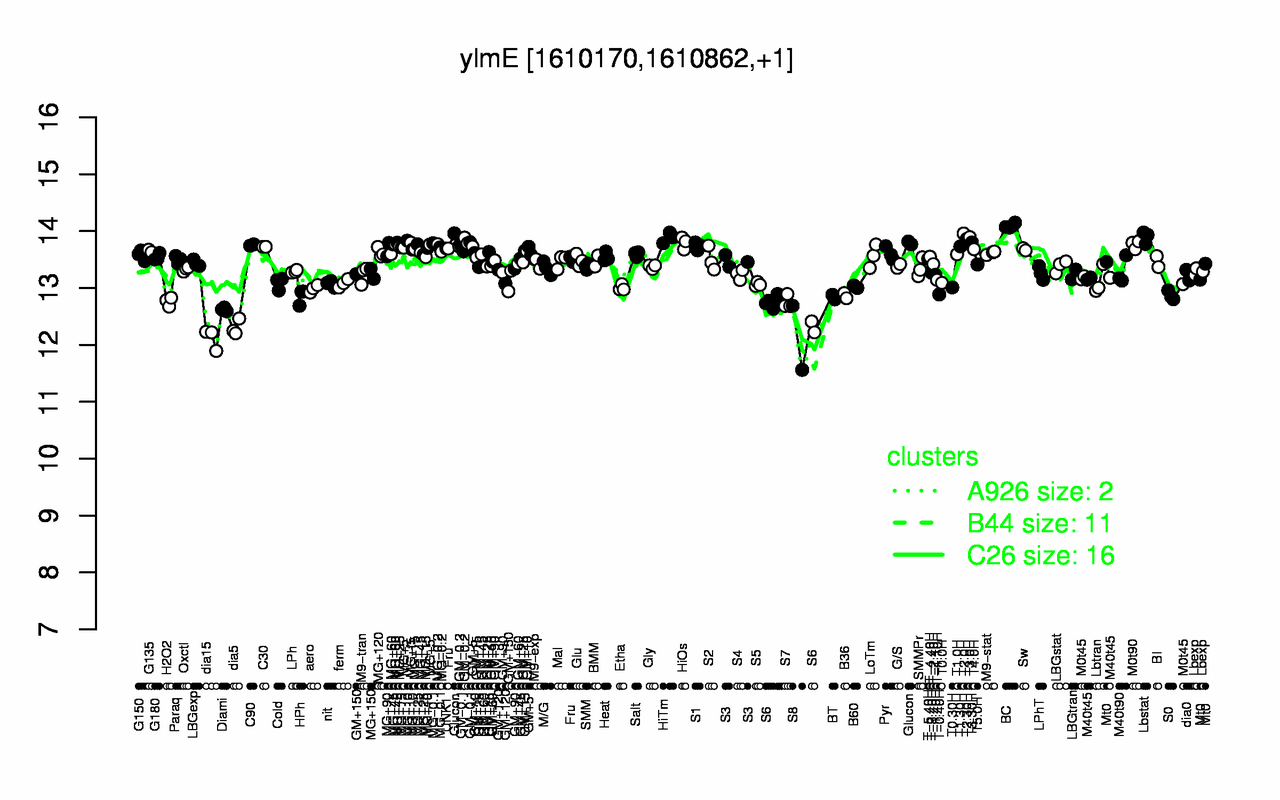
Highest Expression Conditions
BC
T2.0H
T3.0H
Lbstat
HiTm
T2.30H
Glucon
T3.30H
GM-0.2
MG+t5
14.1
14
13.9
13.9
13.9
13.9
13.8
13.8
13.8
13.8
Lowest Expression Conditions
dia15
S8
dia5
Diami
S6
S7
H2O2
BT
HPh
B36
12.1
12.1
12.3
12.6
12.7
12.8
12.8
12.8
12.9
12.9
Most Positively Correlated Segments
ylmD
sepF
lytE
ugtP
pycA
yphF
ypmS
ypmR
yphE
divIVA
0.9
0.73
0.68
0.68
0.66
0.66
0.65
0.65
0.64
0.64
Most Negatively Correlated Segments
ywoC
ywoD
yrzP
S1016
splB
splA
S1120
S466
yugS
ycnE
-0.69
-0.65
-0.64
-0.63
-0.6
-0.59
-0.59
-0.58
-0.57
-0.57
Expression Profile of Segment ylmE
Show/Hide
Annotation of Gene ylmE
Show/Hide
function
16.13: Shape
inference
ab initio prediction:AMIGene:2.0
codon_start
1
product
conserved hypothetical protein
transl_table
11
note
Evidence 4: Homologs of previously reported genes of unknown function; PubMedId: 14526035
db_xref
GI:2633911
protein_id
CAB13412.1
Genomic View of Gene/Segment ylmE
Show/Hide
(Legend)
Browse Genome Context