B. subtilis Expression Data Browser
Start Page
B. subtilis Expression Data Browser
Gene/Segment:
yloB
Locus Tag:
BSU15650
Details about yloB
Show/Hide
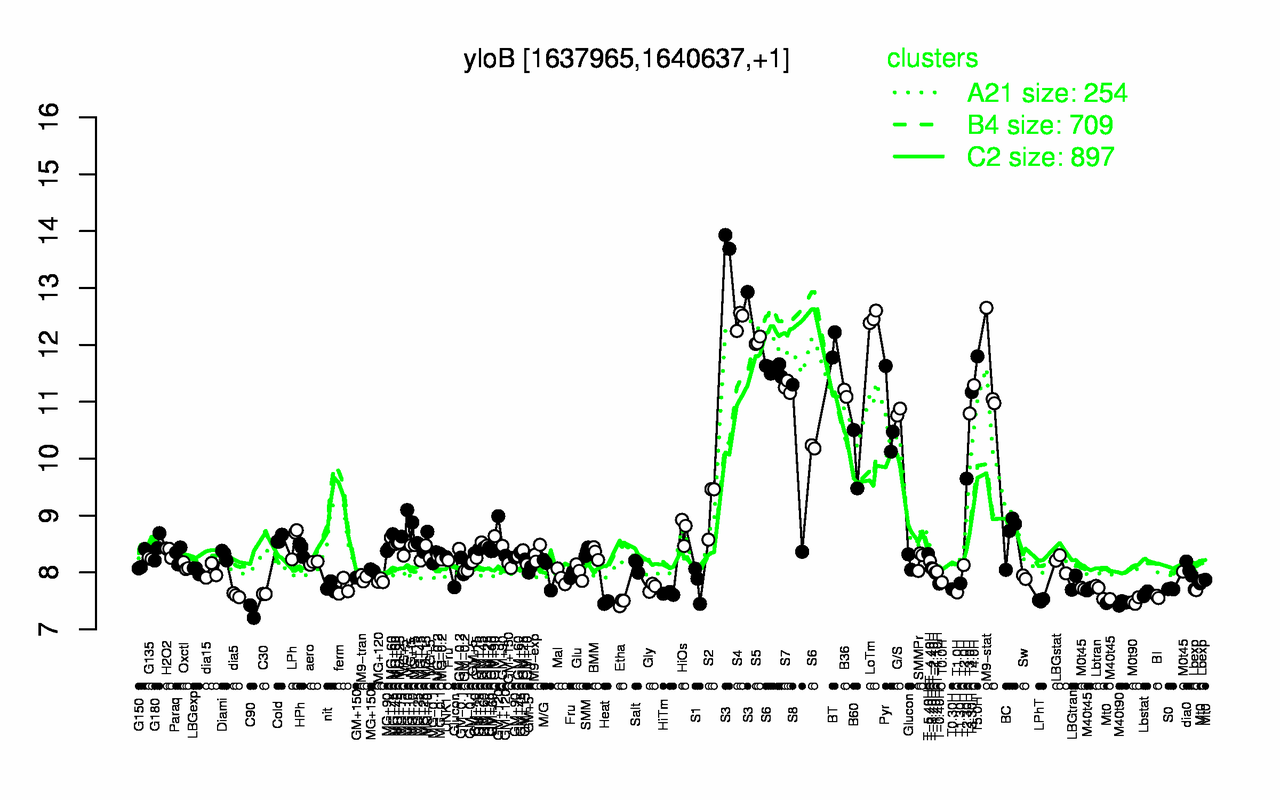
Highest Expression Conditions
S3
LoTm
S4
S5
BT
T5.0H
M9-stat
T4.0H
S6
S7
13.5
12.5
12.4
12.1
12
11.8
11.6
11.3
11.3
11.3
Lowest Expression Conditions
C90
M40t90
Heat
Etha
M0t90
LPhT
BI
dia5
C30
Lbstat
7.31
7.46
7.47
7.47
7.5
7.51
7.57
7.6
7.62
7.63
Most Positively Correlated Segments
ykvU
spoVD
spoIIIAB
spoIIIAE
spoIVFA
spoVB
spoIIIAD
spoIIIAC
spoIIIAA
gerM
0.96
0.95
0.95
0.95
0.95
0.95
0.94
0.94
0.94
0.94
Most Negatively Correlated Segments
sbcD
S1406
S378
addB
sbcC
addA
yceH
yceG
yuxH
S1129
-0.81
-0.81
-0.8
-0.8
-0.8
-0.79
-0.79
-0.78
-0.78
-0.78
Expression Profile of Segment yloB
Show/Hide
Annotation of Gene yloB
Show/Hide
function
16.1: Circulate
inference
ab initio prediction:AMIGene:2.0
codon_start
1
product
P-type calcium transport ATPase
transl_table
11
note
Evidence 1a: Function experimentally demonstrated in the studied strain; PubMedId: 12161109; Product type t: transporter
db_xref
GI:2633938
protein_id
CAB13439.1
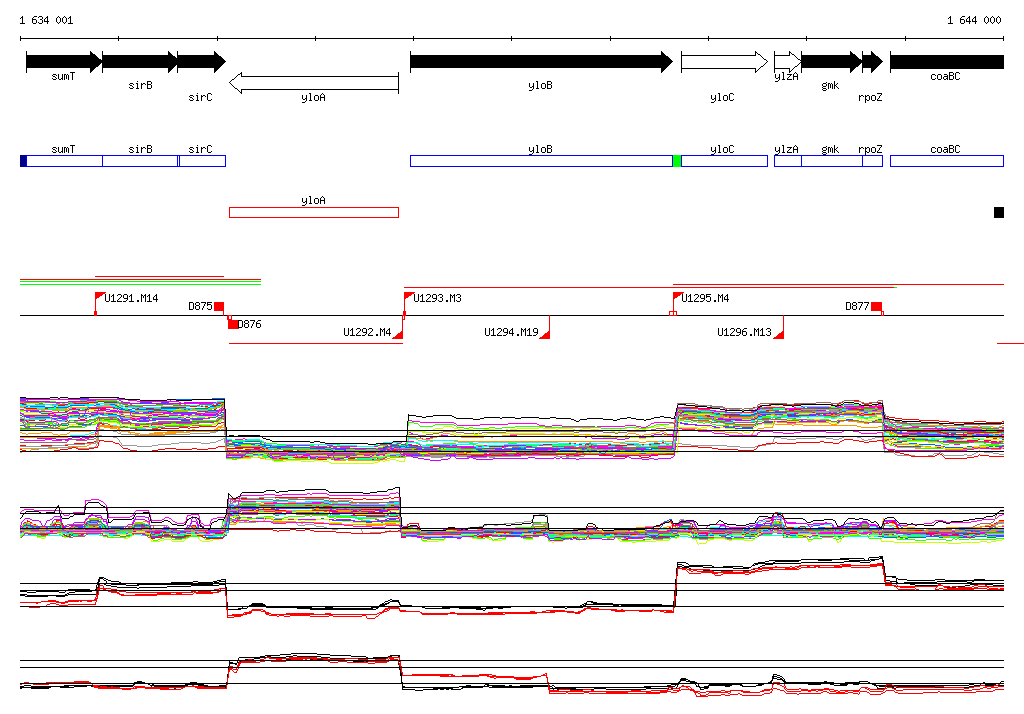
Genomic View of Gene/Segment yloB
Show/Hide
(Legend)
Browse Genome Context