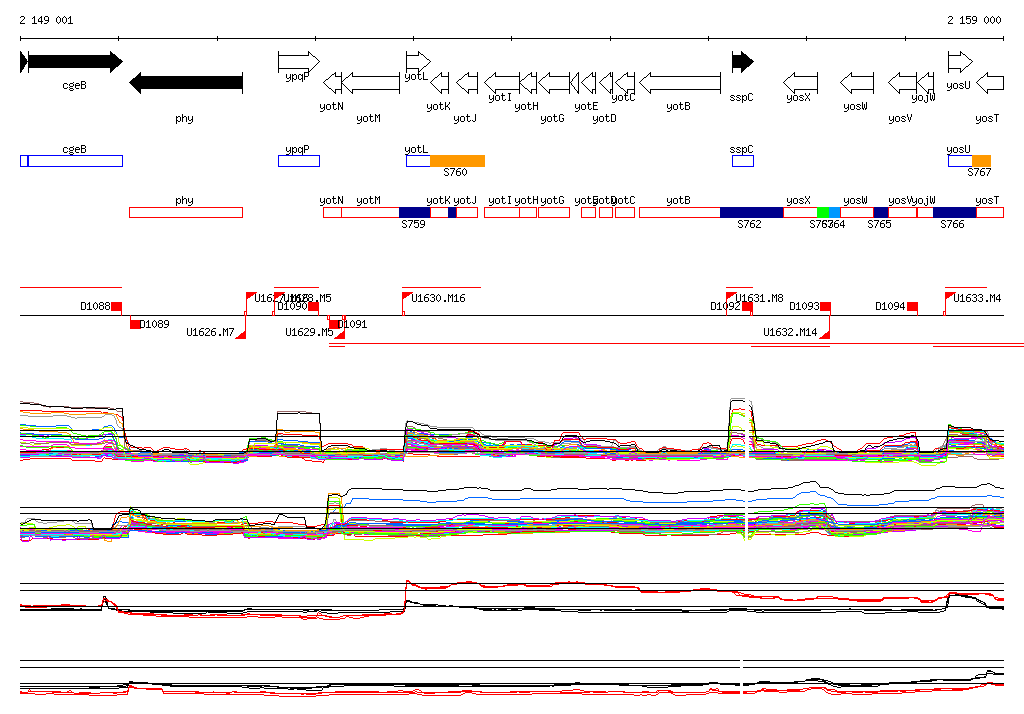
| Start Page |
|
 |
| Start Page |
|
|
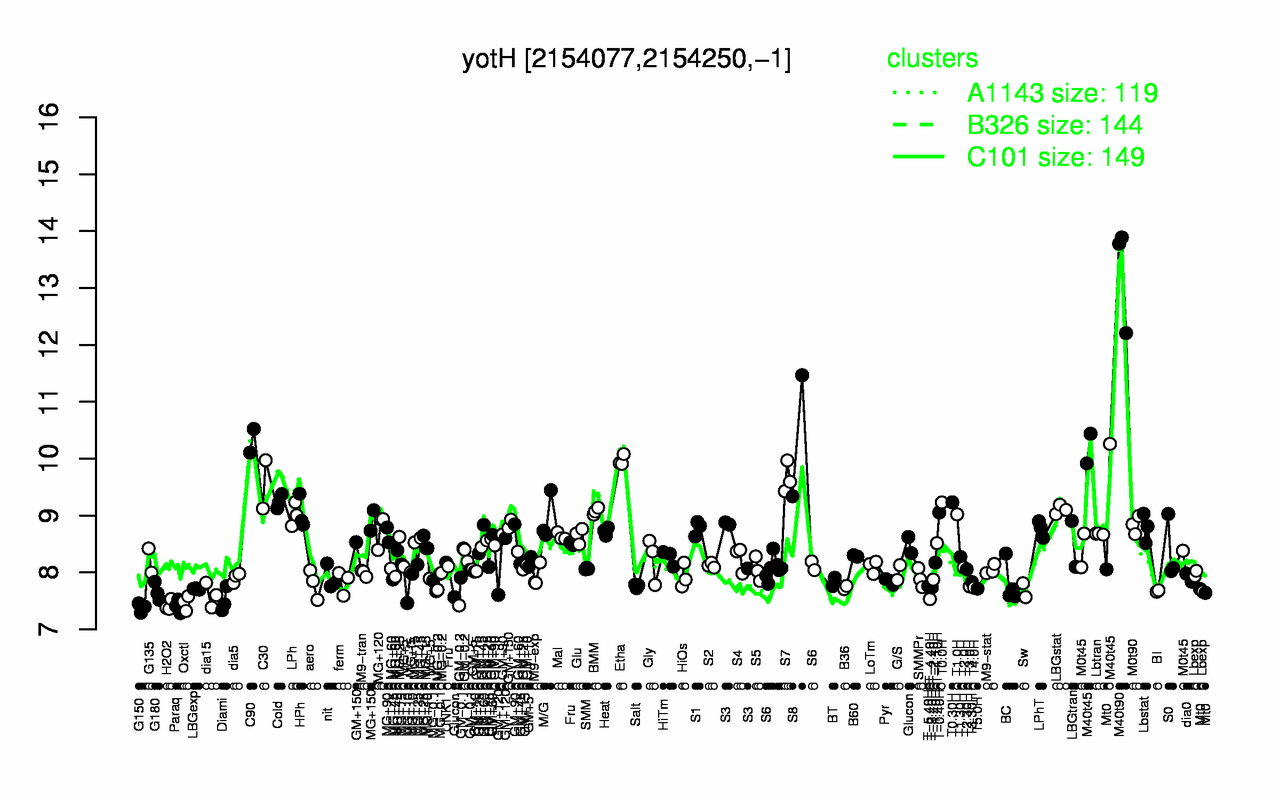
| M40t90 | S8 | C90 | M40t45 | Etha | S7 | C30 | Cold | T0.30H | T0.0H |
| 13.3 | 10.4 | 10.3 | 10.2 | 9.97 | 9.66 | 9.55 | 9.24 | 9.23 | 9.23 |
| G150 | Paraq | H2O2 | Oxctl | Diami | T-4.40H | dia15 | G180 | BI | Sw |
| 7.38 | 7.41 | 7.42 | 7.46 | 7.51 | 7.53 | 7.6 | 7.66 | 7.67 | 7.69 |