| Start Page |
|
 |
| Start Page |
|
|
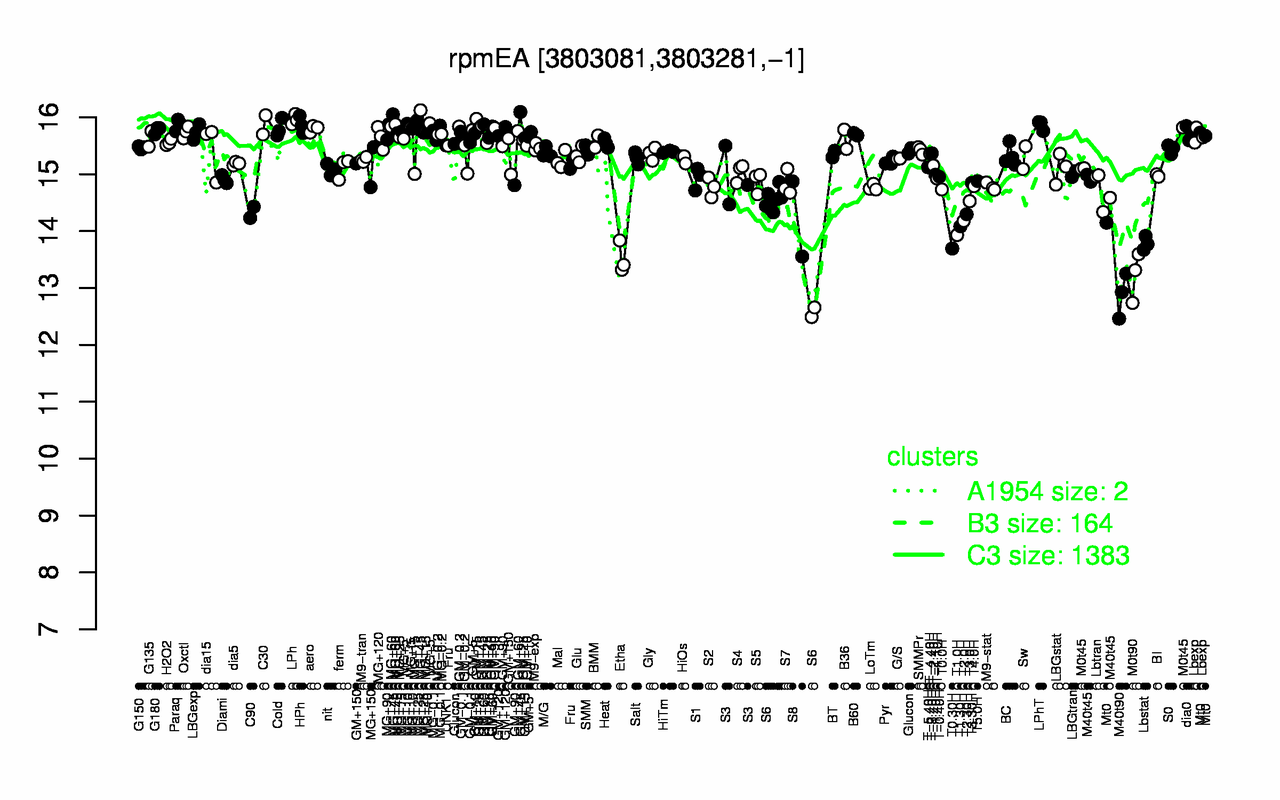
| MG+45 | LPh | GM+45 | HPh | C30 | LPhT | Paraq | MG+60 | GM+60 | MG+t5 |
| 16 | 16 | 15.9 | 15.9 | 15.9 | 15.9 | 15.9 | 15.9 | 15.8 | 15.8 |
| M40t90 | M0t90 | Etha | T0.30H | Lbstat | T1.0H | T1.30H | S6 | T2.0H | S8 |
| 12.9 | 13.2 | 13.5 | 13.7 | 13.8 | 13.9 | 14.1 | 14.1 | 14.2 | 14.2 |