| Start Page |
|
 |
| Start Page |
|
|
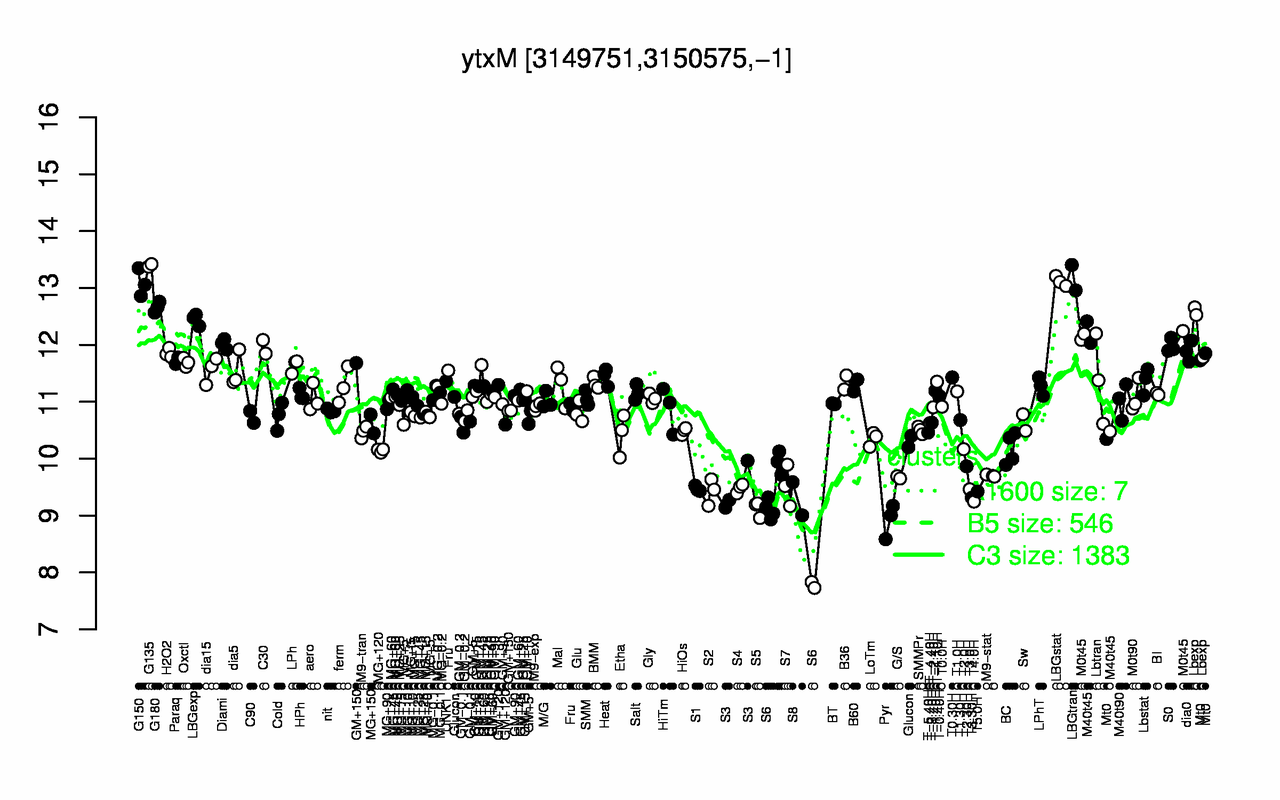
| G135 | LBGtran | LBGstat | G150 | G180 | LBGexp | Lbexp | M0t45 | Diami | S0 |
| 13.4 | 13.2 | 13.1 | 13.1 | 12.7 | 12.4 | 12.3 | 12.2 | 12 | 12 |
| Pyr | S6 | S5 | T4.0H | S8 | T3.30H | S2 | T5.0H | S3 | T3.0H |
| 8.92 | 9.09 | 9.12 | 9.25 | 9.29 | 9.32 | 9.42 | 9.42 | 9.46 | 9.46 |