| Start Page |
|
 |
| Start Page |
|
|
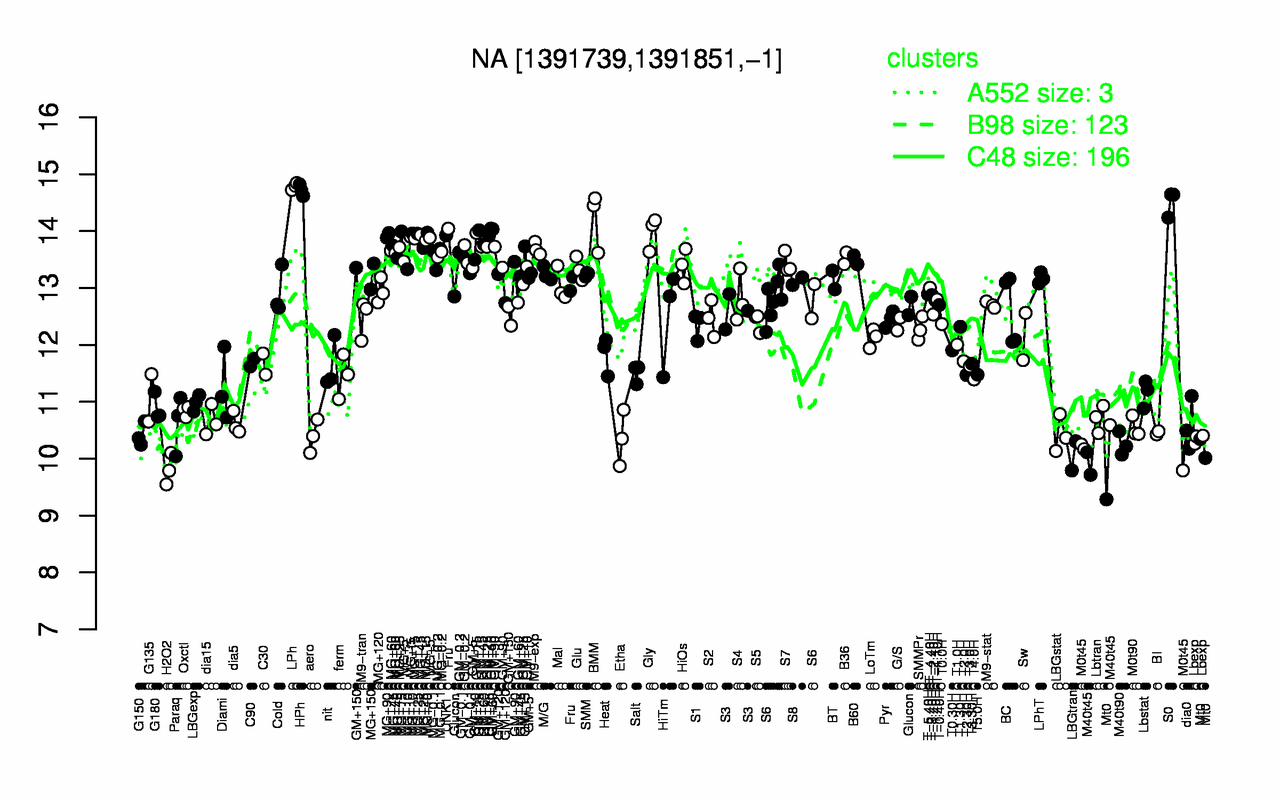
| LPh | HPh | S0 | BMM | Gly | UNK1 | MG+90 | MG+t5 | MG+15 | GM+15 |
| 14.8 | 14.7 | 14.5 | 14.2 | 14 | 13.9 | 13.9 | 13.9 | 13.9 | 13.9 |
| H2O2 | Mt0 | LBGtran | M0t45 | M40t45 | M40t90 | Lbexp | Etha | aero | G150 |
| 9.81 | 9.88 | 10.1 | 10.1 | 10.1 | 10.3 | 10.4 | 10.4 | 10.4 | 10.4 |