B. subtilis Expression Data Browser
Details about ytpB Show/Hide
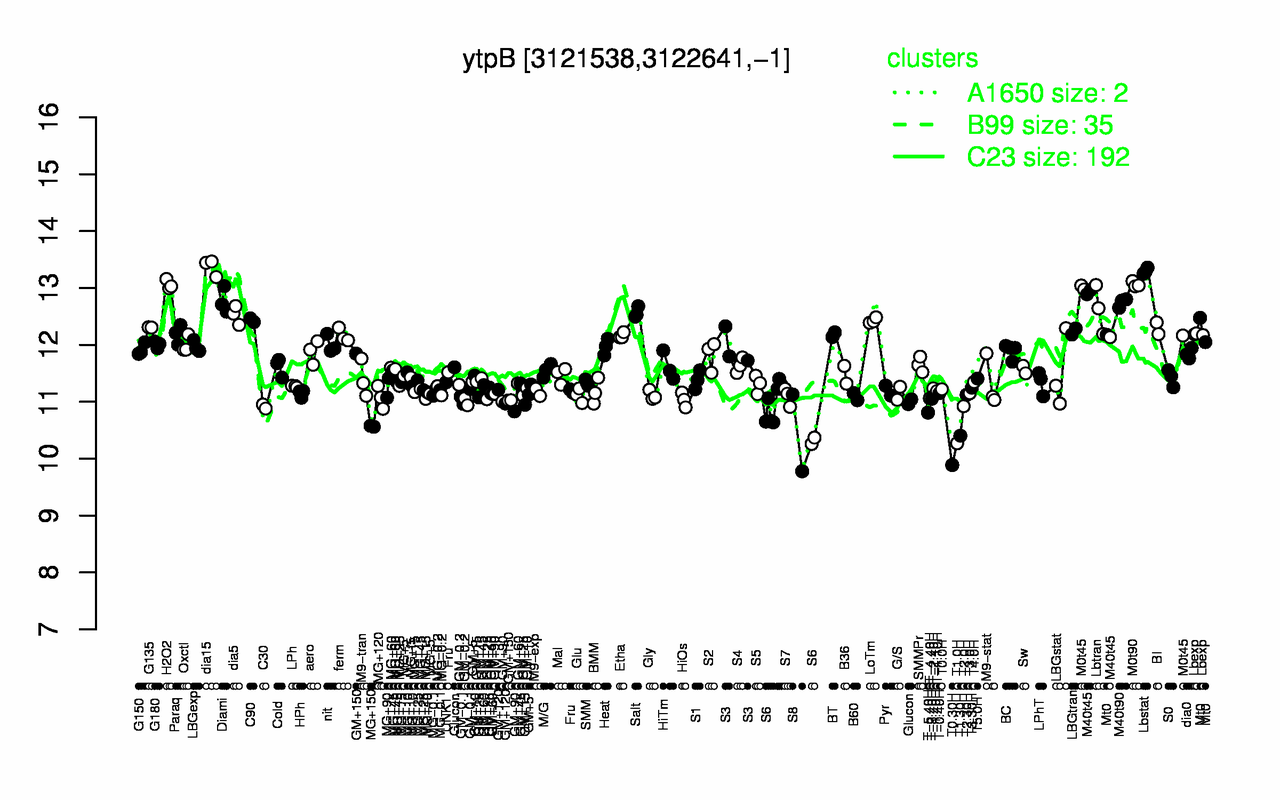
Highest Expression Conditions
dia15 Lbstat M0t90 H2O2 Diami M40t90 M0t45 M40t45 Lbtran Salt
13.4 13.3 13.1 13.1 12.8 12.7 12.7 12.7 12.6 12.6
Lowest Expression Conditions
T0.30H T1.0H T1.30H S8 MG+150 T-5.40H S6 C30 T2.0H GM+90
9.89 10.3 10.4 10.5 10.6 10.8 10.8 10.9 10.9 11
Most Positively Correlated Segments
ytpA S1163 pgcA yqjM yvcJ yvgN ykvZ S1117 whiA yojG
0.95 0.79 0.77 0.76 0.73 0.73 0.72 0.72 0.72 0.72
Most Negatively Correlated Segments
S329 NA NA S92 argB argD carA argJ S101 carB
-0.69 -0.68 -0.68 -0.68 -0.68 -0.67 -0.67 -0.66 -0.66 -0.66
Expression Profile of Segment ytpB Show/Hide
Annotation of Gene ytpB Show/Hide
inference
ab initio prediction:AMIGene:2.0
codon_start
1
product
conserved hypothetical protein
transl_table
11
note
Evidence 4: Homologs of previously reported genes of unknown function
db_xref
GI:2635534
protein_id
CAB15028.1
Genomic View of Gene/Segment ytpB Show/Hide
(Legend)